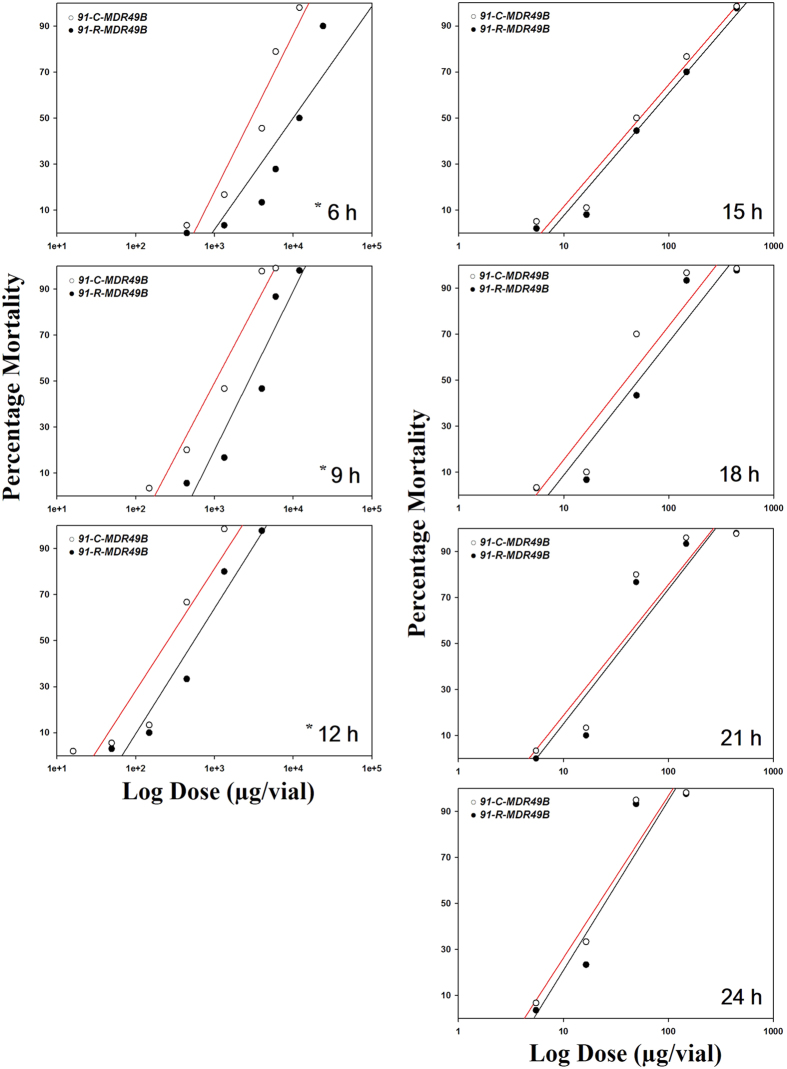
Figure 6. Dose-response curves for the transgenic strains, 91-C-MDR49B and 91-R-MDR49B.
Log dose versus percent mortality response curves were determined at different time interval from 6 to 24 h following contact exposure to DDT (μg/vial), respectively. Asterisks indicate statistically significant differences in the dose responses when the two transgenic strains were compared at 6, 9, and 12 h after DDT treatment, as determined by the maximum-log likelihood ratio test (p < 0.05).

