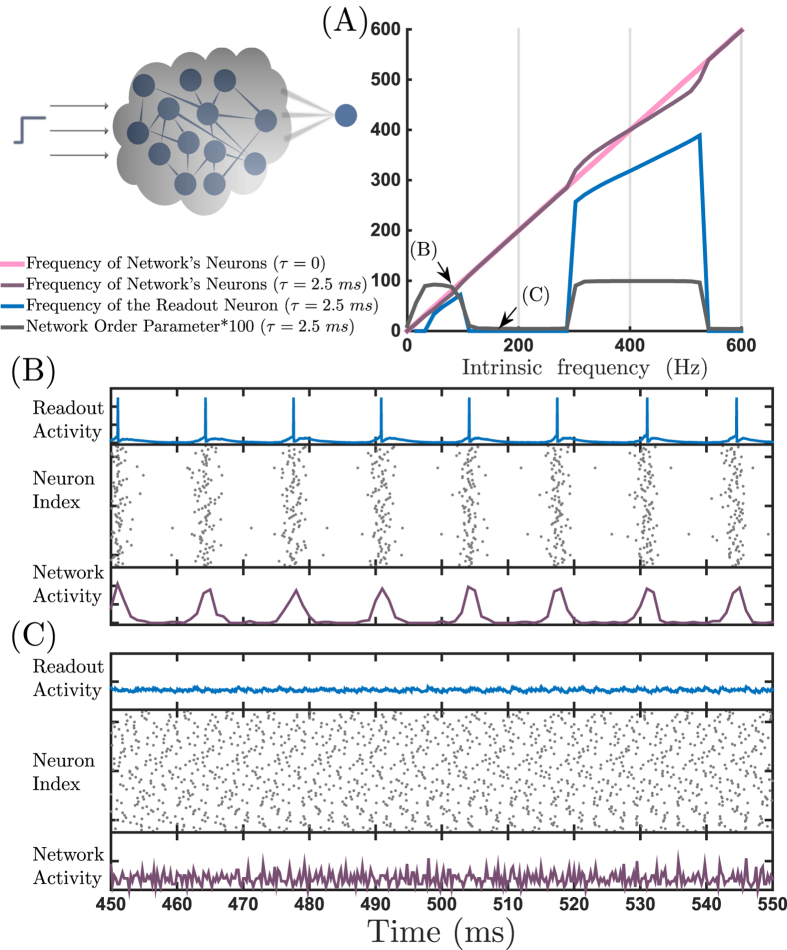
Figure 4. Response of the readout neuron to indirect stimulus.
(A) The pink and purple lines show the mean frequency of the network versus the input currents for instantaneous (without delay) and delayed connections, respectively. The gray curve demonstrates the order parameter of the network and the blue curve represents the response of the readout neuron to the network activity. (B,C) show the voltage of the readout neuron (top), raster plot of the spiking activity of the network (middle) and the network activity (bottom) for two different amounts of input current which lead to coherent and incoherent activity of the network, respectively.

