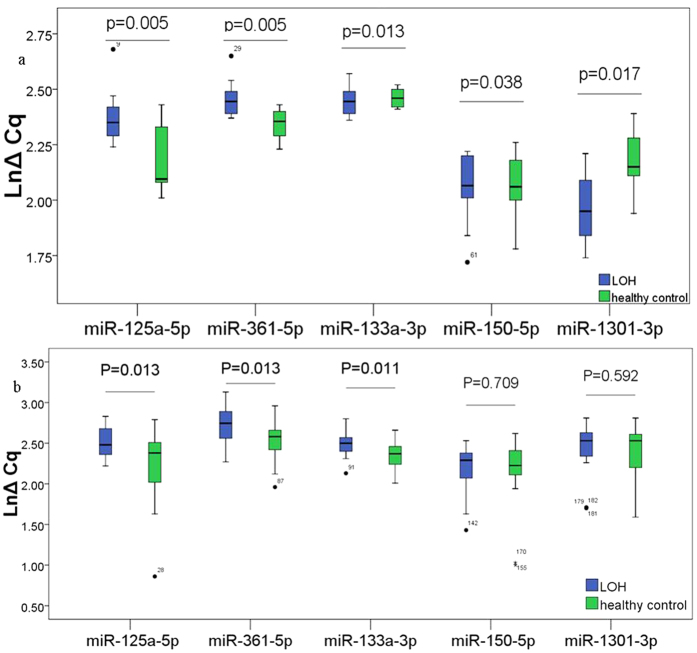
Figure 2. The different expressions of miRNAs are in LOH patients and healthy controls.
The blue Boxplot represent LOH group, green Boxplot represent healthy control group. Expression levels of the miRNAs (LnΔCq scale at Y-axis) were normalized by the mean Cq value of let-7b-5p, let-7i-3p and U6 snRNA. Low expression level of the miRNA has a high LnΔCq scale. The line represents the median value. Wilcoxon signed-rank test was used to determine statistical significance. (a) Investigation of 16 selected single miRNAs using fq-RT-PCR in training set. The results showed that miR-125a-5p, miR-361-5p, miR-150-5p and miR-133a-3p were significantly decreased in LOH patients when compared with control group; while miR-1301-3p was increased in LOH patients. (b) Large-scale validation of the 5 miRNAs that were selected from the training set. The results showed that miR-125a-5p, miR-361-5p and miR-133a-3p were significantly decreased in LOH patients compared with healthy controls.

