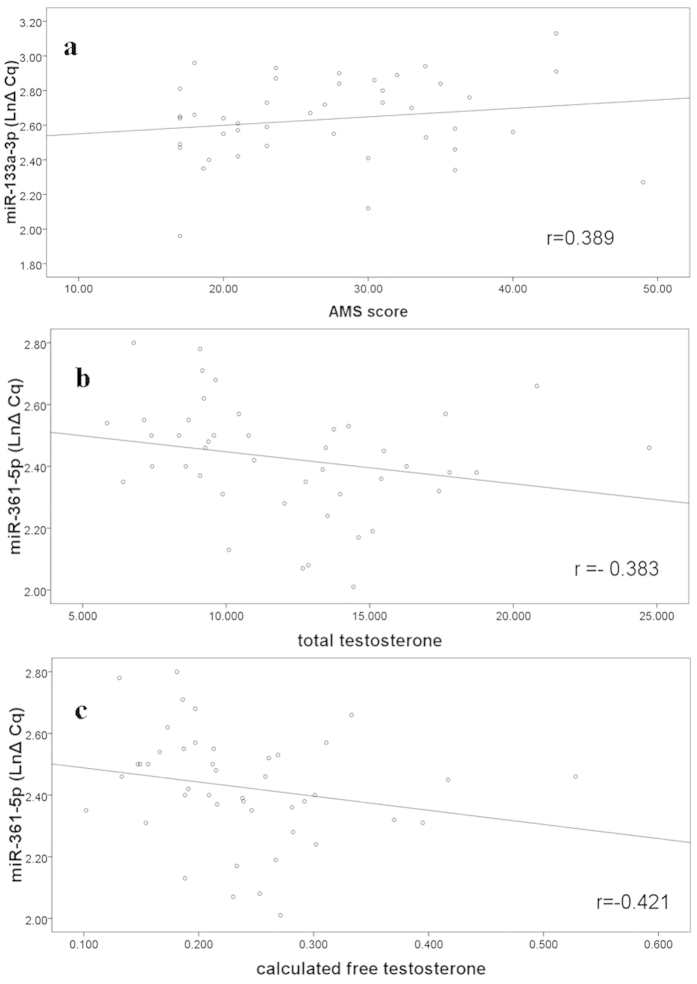
Figure 4. The relationships between plasma level of miR-125a-5p, miR-361-5p and miR-133a-3p with clinical characteristics.
Expression levels of miRNAs (LnΔCq scale at Y-axis) were normalized by the mean Cq value of let-7b-5p, let-7i-3p and U6 snRNA. The results show that miR-133a-3p level was significantly associated with AMS (r = −0.389, p = 0.010) (a), and there were significant associations between miR-361-5p with the serum total testosterone and calculated free testosterone concentrations (r = 0.383 and r = 0.421, p = 0.010 and p = 0.004) (b,c).

