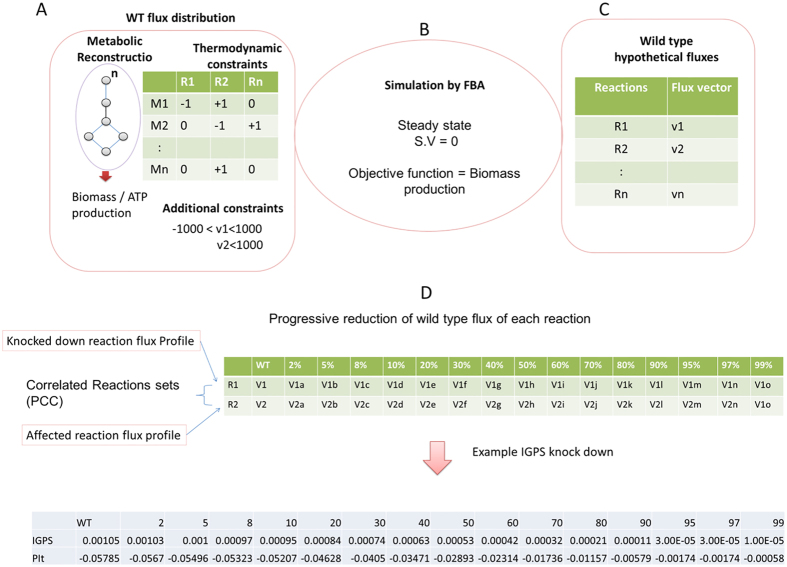
Figure 1. Identifying correlated reaction sets in Genome Scale Metabolic Reconstruction.
(A,B) The genome scale metabolic network reconstruction updated iNJ661m (iNJ661mu) built using genome annotation, and bibliographic data. Using stoichiometric coefficient as thermodynamic constraint and other constraints as reaction bounds, these models could be used to simulate growth rate or biomass production (objective function in LP problem) in silico using Flux Balance Analysis approach assuming steady state. (C) Represents the wild type flux distribution of reactions. (D) Matrix of flux profiles of reactions shows flux profile of reaction R1 and flux profiles of affected reaction R2. All fluxes are shown V1 and V2 in WT and V1a is flux of R1 at 2% knock down and V2a is new flux of R2 at 2% flux reduction of WT flux of R1 and so on. Example is given as IGPS (Indole-3-glycerol phosphate synthase) knock down and affected reaction PIt (Inorganic phosphate transporter).

