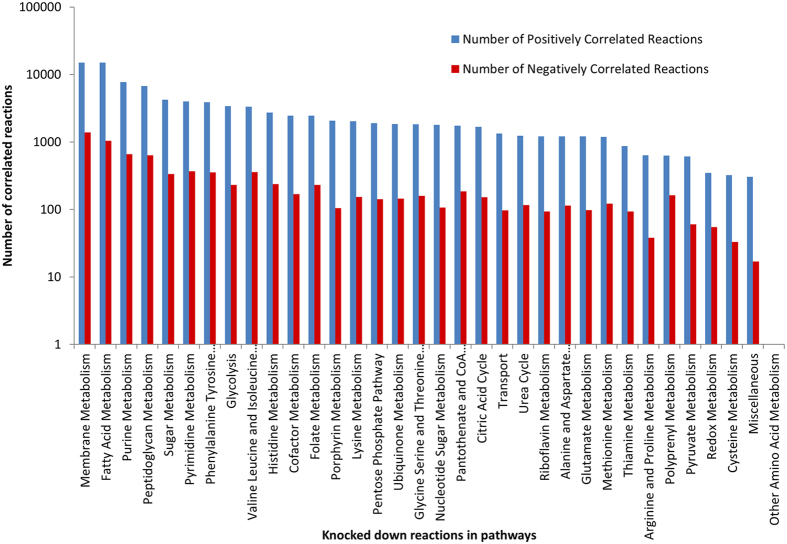
Figure 3. Numbers of reactions with correlated fluxes corresponding to knocked down of reactions in different metabolic pathways.
X-axis: the pathways to which the knocked down reaction belongs and Y-axis: Numbers of reactions of affected pathways shown as bar histograms (Blue color: Positively correlated reactions and Red color: Negatively correlated reactions).

