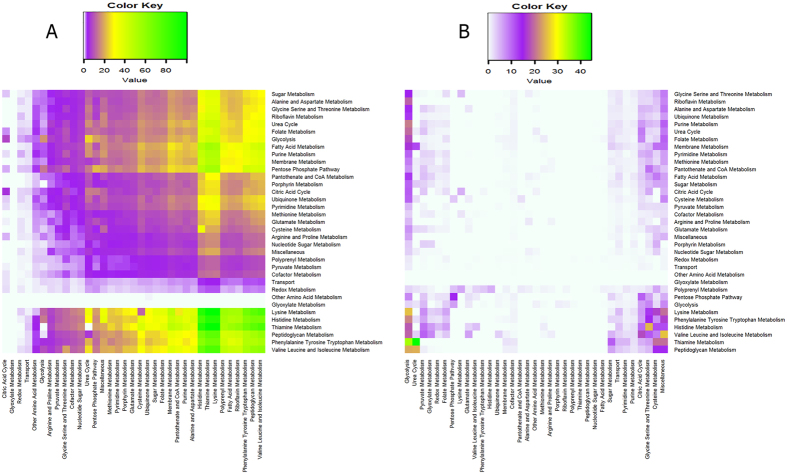
Figure 4.
2-dimensional colourmap display of the scale of effects scored in terms of the numbers of reactions affected (reaction pairs) with respect to the total number of possible pairs in affected pathways on knockdown of reactions of a given pathway (in percentages) (A) positively correlated reactions, (B) negatively correlated reactions. The colour code corresponding to the numbers of affected reactions is shown in the corresponding scale bar. The knockdown pathways are in the rows and the affected pathways are in the columns.

