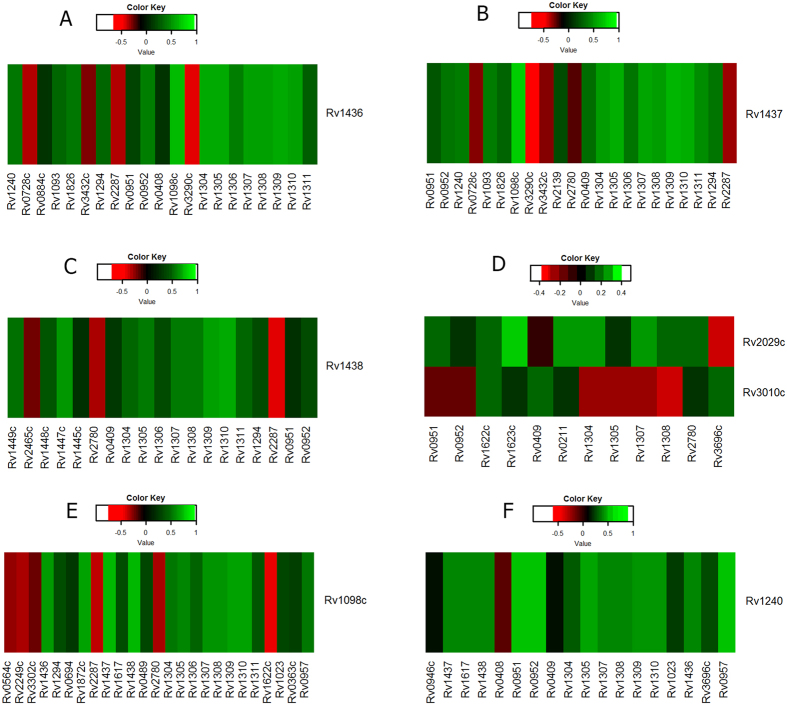
Figure 8. Gene expression correlation of genes associated with reactions of glycolysis and citric acid cycle pathways.
The correlation values of one gene versus the rest are plotted in color coded format. The color code range bar corresponding to the correlation values is shown. (A) fumarase (B) malate dehydrogenase (C) glyceraldehyde-3-phosphate dehydrogenase (D) Phosphofructokinase (E) phosphoglycerate kinase (F) triose phosphate isomerase. Rows: genes of knocked down reaction, Columns: genes associated with negatively correlated flux of reactions with associated genes co-expressed. The scale bars are uniformly set −1 to +1 in colour scale ranging from red to green in all cases. However, in cases where the extreme values are absent, the colours are only assigned to the next minimum and maximum values available. Therefore the interpretations is that red signifies normalised low score values whereas green signifies normalised high score values.

