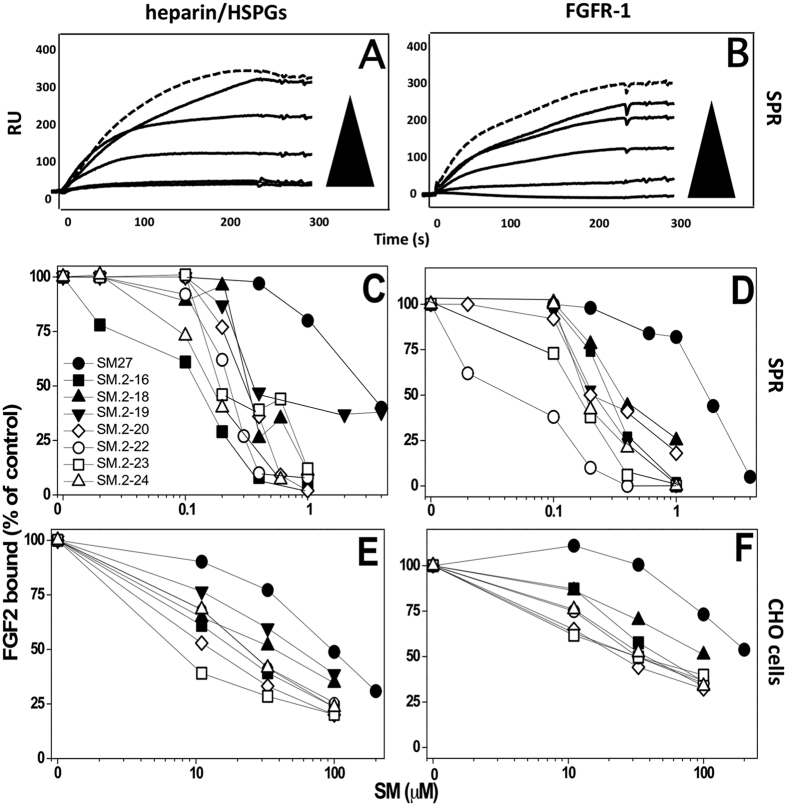
Figure 3.
Inhibitory activity of the selected hits on the binding of FGF2 to heparin/HSPGs (A,C,E) or FGFR-1 (B,D,F). (A,B) Representative sensorgrams overlays derived by the injection of FGF2 (159 nM) in the absence (top hatched sensorgram) or in the presence of increasing concentrations of SM.2–22 on the heparin or FGFR-1 surfaces, respectively. (C,D) FGF2 (150 nM) was injected over heparin (C) or FGFR-1 (D) immobilized to a SPR sensorchip in the absence or in the presence of increasing concentrations of the indicated compounds and the amount of FGF2 bound to the surfaces in the different experimental conditions was measured. Each point is the mean of 3 experiments. (E,F) Binding of Eu-FGF2 (10 ng/ml) to CHO cell clones selectively expressing either HSPGs (E) or FGFR-1 (F) in the presence of increasing concentrations of the compounds. Each point is the mean of 2–3 experiments. Data are expressed as mean values of the percentage of bound FGF2 compared to control (in the absence of competing compounds).

