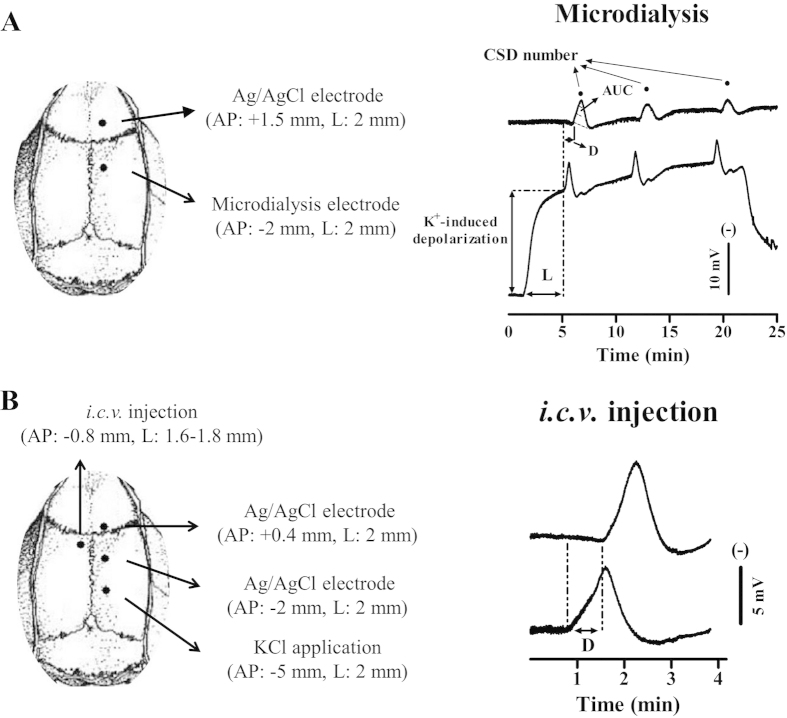
Figure 5. Schematic representation of electrode implantation sites (left) and representative traces in DC potential of CSD (right) induced by K+ through microdialysis probe (upper) and topical application (lower) in the anaesthesized rat.
(A) In microdialysis based CSD experiment (upper), CSD wave in the genesis site was recorded by perfusion of 250 mM KCl through the microdialysis probe implanted at 2 mm posterior to bregma in the rat right cortex. CSD propagation wave was simultaneously recorded through the Ag/AgCl electrode implanted at 1.5 mm anterior to bregma. Drugs or ACSF was perfused through the microdialysis probe for pharmacology study. (B) In intracerebral ventricle (i.c.v) based experiment (lower), CSD was induced by topical application of 3 M KCl through the hole with dura intact at 5 mm posterior to bregma in the right skull. CSD propagation wave was recorded at both 2 mm posterior to and 0.4 mm anterior to bregma. The drug or ACSF was perfused into contralateral ventricle through a cannula implanted (lower left). CSD magnitude is indicated as Area under the curve (AUC, dotted line, right upper trace). CSD latency (L) and CSD number are used to assess the susceptibility of the cortex to K+ induced CSD. CSD propagation rate is used to assess the susceptibility of the cortex to CSD propagation as calculated by the distance dividing by the time delay (D, right).

