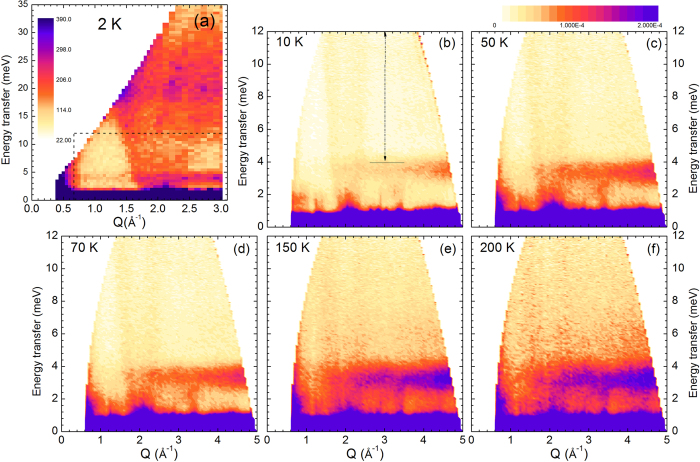
Figure 3. Temperature evolution of the dynamical properties of AgCrSe2, showing the localized lattice mode at 3 meV and the dispersive magnetic signal at Q = 2 Å−1.
Figure 3a is an overview of the spectrum up to 35 meV (triple-axis, kf = 2.662 Å−1) at 2 K, Fig. 3b–f (time-of-flight data, λi = 2.2 Å) are a higher resolution mapping of the E < 12 meV area (corresponding to the dashed zone of Fig. 3a) at different temperatures.

