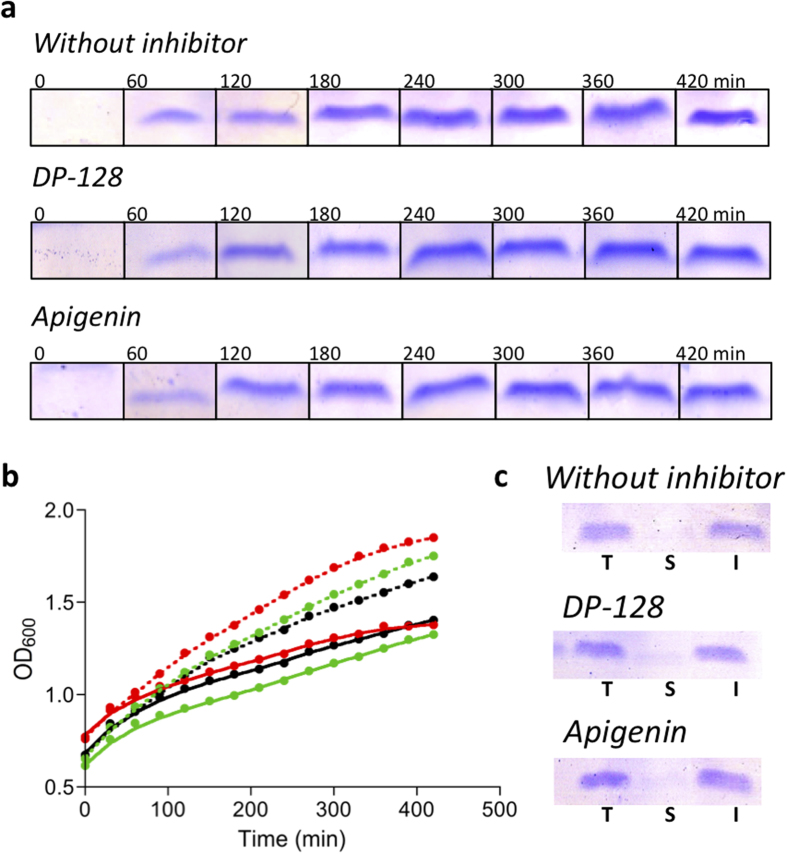
Figure 3. Aβ40 expression and bacterial growth in the absence and presence of inhibitors.
(a) Protein expression in bacterial cultures along the time tracked by tricine-SDS-PAGE. (b) Bacterial growth monitored by optical density at 600 nm (OD600); the ODs were measured in triplicate and the standard errors were less than 5%. In black, red and green, in the absence (control) and presence of 10 μM DP-128 and apigenin, respectively. Solid and dashed lines show induced and non-induced cultures, respectively. (c) Aβ40 distribution in bacteria: Total (T), soluble (S) and insoluble (I) fraction of Aβ40 at end-point of kinetics.

