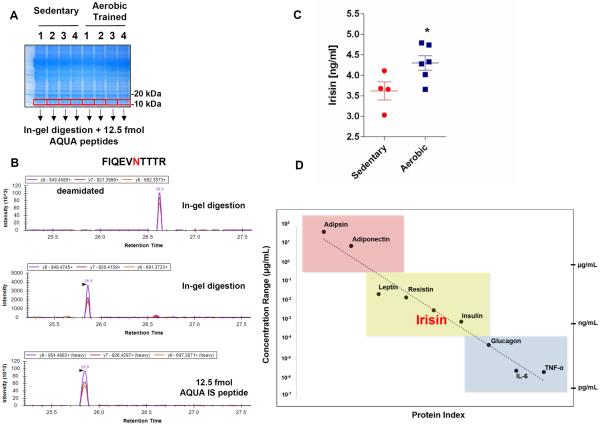
Figure 2. Detection of Irisin in Human Plasma.
(A) SDS PAGE separation of 50 μg of plasma from each subject and visualized by coomassie staining. Molecular mass regions corresponding to completely deglycosylated irisin (10–15 kDa) were excised from six separate gels (300 μg from the original 100 μl plasma) for each subject and digested in-gel in the presence of 12.5 femtomoles of each internal standard AQUA peptide.
(B) PRM elution profile for internal tryptic irisin peptide (FIQEVNTTR) using Skyline software found in sedentary subject 1. Top panel is the deamidated asparagine form of the peptide found in the plasma, middle panel is the unmodified peptide found in the plasma and the bottom panel is 12.5 femtomoles of heavy internal standard (IS) AQUA peptide.
(C) Irisin levels in plasma from sedentary subjects (Sedentary) or subject undergoing aerobic interval training (Aerobic). Values are shown as mean±SEM. n=4 (Sedentary) and n=6 (Aerobic). * p= 0.0411 compared to sedentary subject group as determined by unpaired t-test, two-tailed.
(D) Depicted are several plasma proteins and their circulating concentrations ranging from the μg/ml (red), ng/mL (yellow) and pg/ml (blue) levels. We quantify circulating plasma irisin at a 3–5 ng/ml. See also Figure S2.

