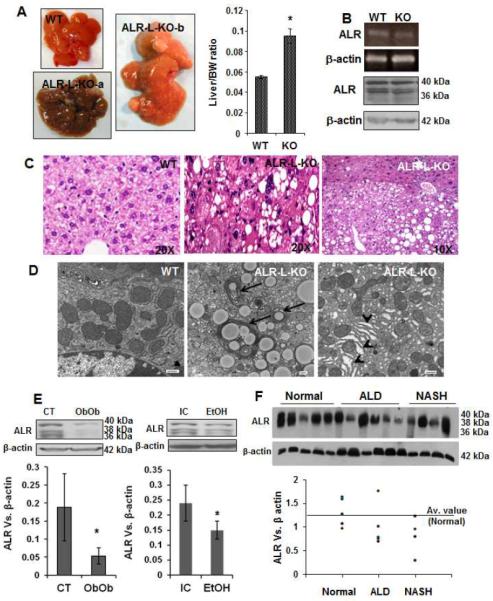
Figure 7. Liver tumor development in ALR-L-KO mice and ALR in murine and human fatty liver disease.

(A) Macroscopically, there were multiple tumors in ALR-L-KO livers at 1 year. Bar graph shows liver/body weight ratio in ALR-L-KO and WT mice (*P<.01). (B) ALR mRNA and protein expressions as determined by semi-quantitative RT-PCR and Western blot analysis, respectively, were similar in WT and ALR-L-KO livers. (C) The tumor (HCC) and non-tumor regions of the ALR-L-KO liver are shown. HCC is characterized by the loss of liver structure with mitotic figures and anaplastic nuclei. (D) TEM shows lipid accumulation and autophagosomes (arrows) as well as ER dilation (arrowheads) in ALR-L-KO liver at 1 year. Bar=500nm. (E) Western analysis shows hepatic ALR expression in Ob/Ob mice (8 weeks of age), mice fed Lieber-De Carlie isocaloric (IC) or alcoholic (EtOH) diet for 5 weeks that resulted in fatty liver, and (F) humans with advanced ALD or NASH. Bar graphs in (E) show ratio of ALR vs β-actin expression (n=5 each) ± SD. In the graph for (F), ALR vs β-actin ratio was plotted individually.
