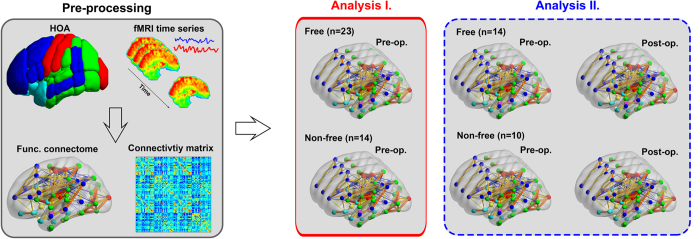
Figure 2. Overview of the analytic strategy.
First, cortical and subcortical brain regions were parcellated according to the Harvard-Oxford atlas. Next, a weighted connectivity matrix was constructed from preprocessed functional data. Then, we compared the preoperative functional connectome of seizure-free and non-seizure-free groups (Analysis I); and performed two-way mixed ANOVA for the pre- and postoperative functional connectomes of the two patient groups (Analysis II).

