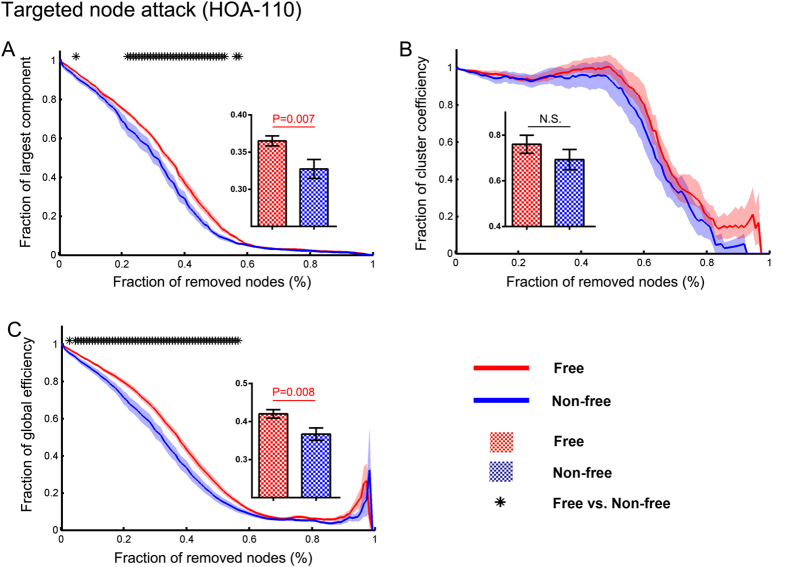
Figure 3. Network resilience analysis.
Graphs display the network features as a function of removed nodes. All the features (largest component, clustering coefficient, and global efficiency) were normalized to the measures obtained from the intact network. “Asterisks” illustrate measures that were statistically significant between seizure-free and non-seizure-free groups for each level network attack (P < 0.05 corrected). Shaded bands denote SEM across subjects. Bar graphs represent the resilience of the area under the curve of patient groups.

