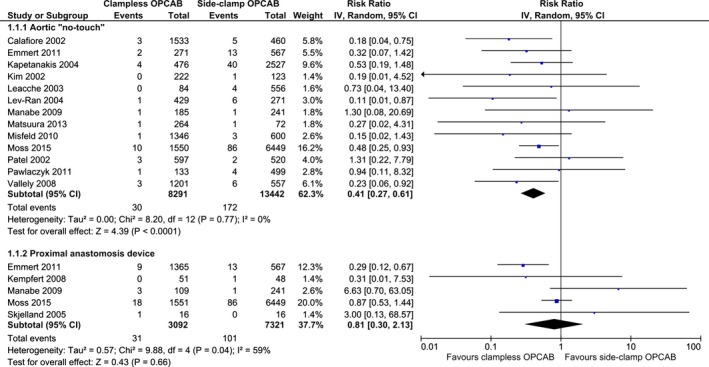
Figure 6.

Sensitivity analysis of primary end point—30‐day cerebrovascular accident stratified by the OPCAB technique after exclusion of studies not reporting diagnostic criteria for primary end point. Each square denotes the RR for the within‐study comparison with the horizontal lines showing the 95% CI. The size of the square is directly proportional to the statistical weight of each study. The black diamond shapes give the pooled RR from the random‐effects model; the center of the diamond denotes the RR and the extremities the 95% CIs. IV indicate inverse variance.
