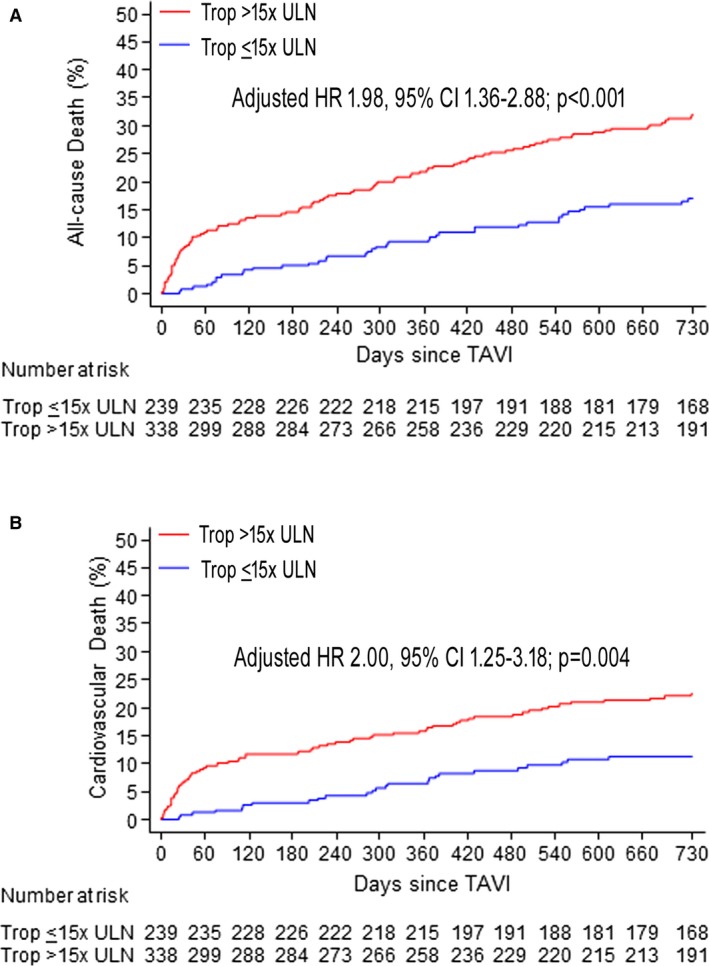
Figure 2.

Cumulative event curves for all‐cause mortality (A) and cardiovascular death within 2‐year follow‐up (B) in patients with or without post‐TAVI cTnT elevation >15× ULN. cTnT indicates cardiac troponin T; HR, hazard ratio; TAVI, transcatheter aortic valve implantation; Trop, troponin; ULN, upper limit of normal.
