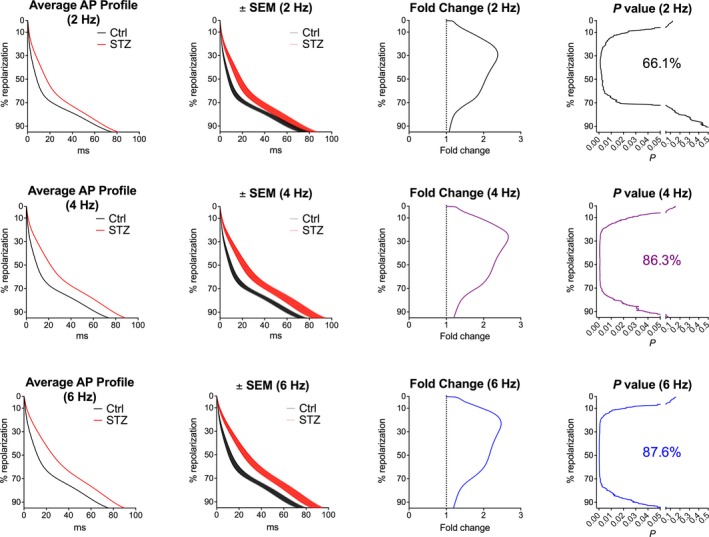
Figure 6.

Hyperglycemia and AP properties at different pacing rates. Analysis and comparison of repolarization properties of AP using the novel algorithm. Control (Ctrl) myocytes (n=22; from 12 mice) and myocytes obtained from streptozotocin (STZ) ‐treated female mice (n=27; from 12 mice at 18–45 days after onset of hyperglycemia) were stimulated at 2‐, 4‐, and 6‐Hz pacing rates. Graphs of average AP profile represent the calculated average repolarization phase of the AP for Ctrl and STZ myocytes. Corresponding error bars, fold changes for the duration of the AP in STZ vs Ctrl cells, and statistical difference are reported in the ±SEM, fold change, and P‐value graphs, respectively. AP indicates action potential
