
Figure 9.
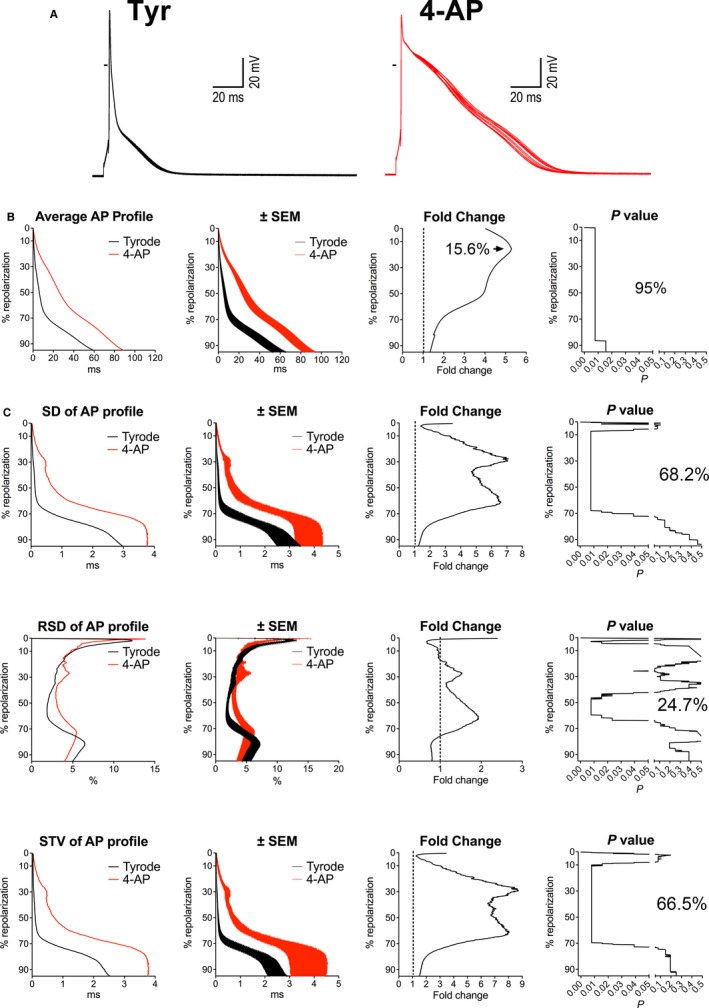
Inhibition of Kv currents prolongs the AP and enhances beat‐to‐beat variability. A, Superimposed sequential APs of a nondiabetic myocyte before and after exposure to 0.1 mmol/L of 4‐AP. B, Analysis and comparison of repolarization properties of the AP using the novel algorithm, for myocytes obtained from female mice before and after exposure to 4‐AP (n=8; from 5 mice). Graph of average AP profile represents the calculated average repolarization phase of the AP in myocytes before and after exposure to 4‐AP. Corresponding error bars, fold changes for the duration of the AP in 4‐AP vs Tyrode (Tyr), and statistical difference are reported in the ±SEM, fold change, and P‐value graphs, respectively. C, Variability of repolarization of the AP before and after exposure of 4‐AP evaluated by SD, RSD, and STV in cells reported in (B), using the novel algorithm. Graphs of SD, RSD, and STV of AP profile represent the calculated average variability of the repolarization phase of the AP for myocytes in Tyrode and after exposure to 4‐AP. Corresponding error bars, fold changes for the variability of the AP collected in 4‐AP vs Tyrode, and statistical difference are reported in the ±SEM, fold change, and P‐value graphs, respectively. 4‐AP indicates 4‐aminopyridine; AP, action potential; STV, short‐term variability.