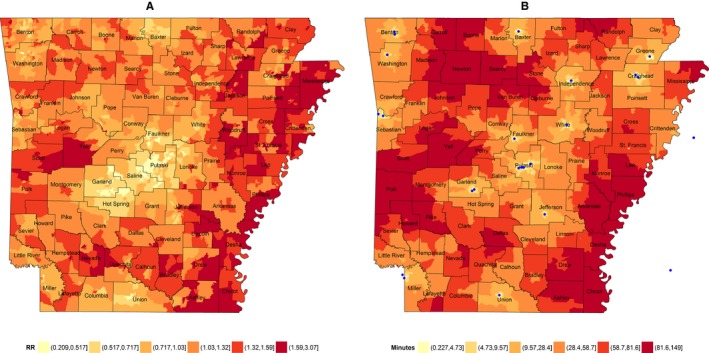
Figure 2.

A, Block group (BG)–specific estimates of the relative risk for acute myocardial infarction mortality among Arkansans, ages 30+, during 2008–2012. (B) Driving time from population center of BG to the nearest percutaneous coronary intervention–capable hospital (blue dots). Estimates (RR) are based on trends in the standardized mortality ratio with BG measures of education, poverty, population density, percent rural, black race, and geographical location (spatial trends). The 10th, 25th, 50th, 75th, and 90th percentiles among BGs determine the boundaries of color interval.
