
Figure 2.
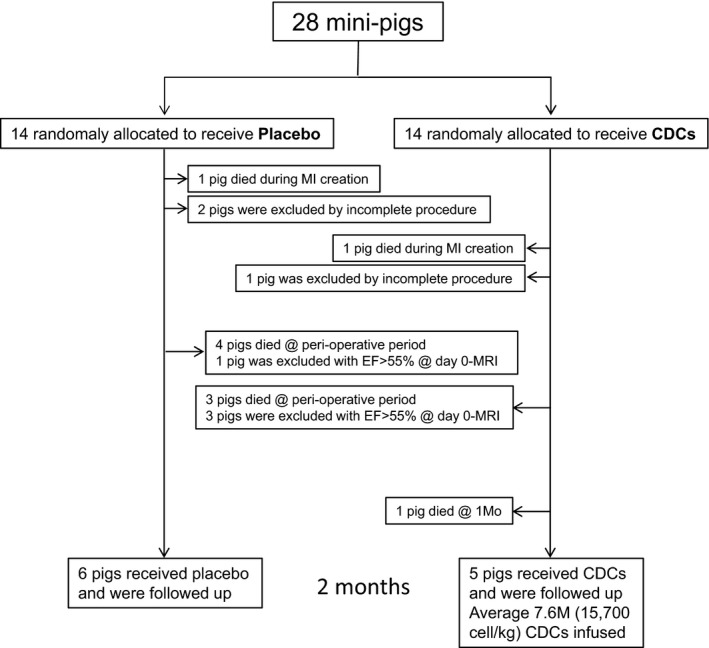
Flow chart of experimental design. CDCs indicates cardiosphere‐derived cells; EF, ejection fraction; MI, myocardial infarction; MRI, magnetic resonance imaging.
Official websites use .gov
A
.gov website belongs to an official
government organization in the United States.
Secure .gov websites use HTTPS
A lock (
) or https:// means you've safely
connected to the .gov website. Share sensitive
information only on official, secure websites.
Flow chart of experimental design. CDCs indicates cardiosphere‐derived cells; EF, ejection fraction; MI, myocardial infarction; MRI, magnetic resonance imaging.