
Figure 9.
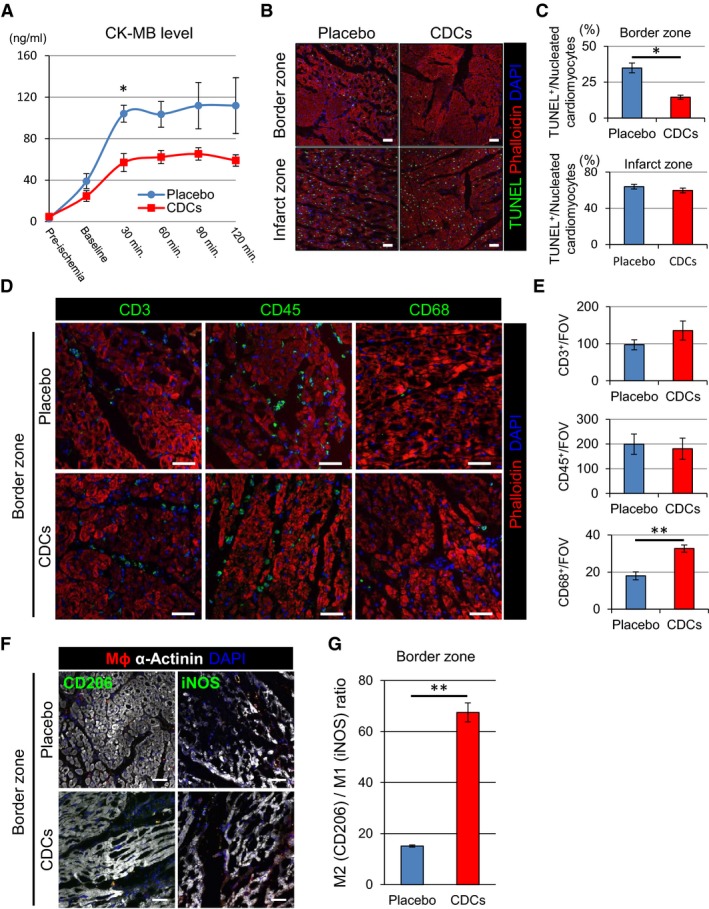
Allogeneic CDCs induce cytoprotective effects by anti‐inflammatory and ‐apoptotic mechanisms. Level of serum CK‐MB with placebo‐ and CDC‐treated pigs during the 2 hours postintervention (A). TUNEL staining in border and infarct zones of placebo and CDC‐treated pigs 2 hours postintervention (B). Quantification of TUNEL‐positive cardiomyocytes in border and infarct zones of placebo and CDC‐treated pigs (C). Representative images (D) and quantification (E) of inflammatory cell infiltration (CD3, CD45, and CD68) in border zone of placebo‐ and CDC‐treated pigs 2 hours postintervention. Representative images of M1 (iNos+) and M2 (CD206+) macrophages in the border zone of placebo‐ and CDC‐treated pigs 2 hours postintervention (F). Macrophage polarization markers iNos (M1) and CD206 (M2) were utilized to differentiate the proportion of infiltrating M1 and M2 macrophages within the border zone tissue 2 hours postintervention. Data are presented as the number of CD206+ vs iNos+ macrophage per field of view (G). Values are means±SEM. *P<0.05 and **P<0.01 between 2 groups. Scale bars are 50 μm in (B, D, and F). CDCs indicates cardiosphere‐derived cells; CK, creatine kinase; iNOS, inducble nitric oxide synthase; TUNEL, terminal deoxynucleotidyl transferase dUTP nick end labeling.