
Figure 4.
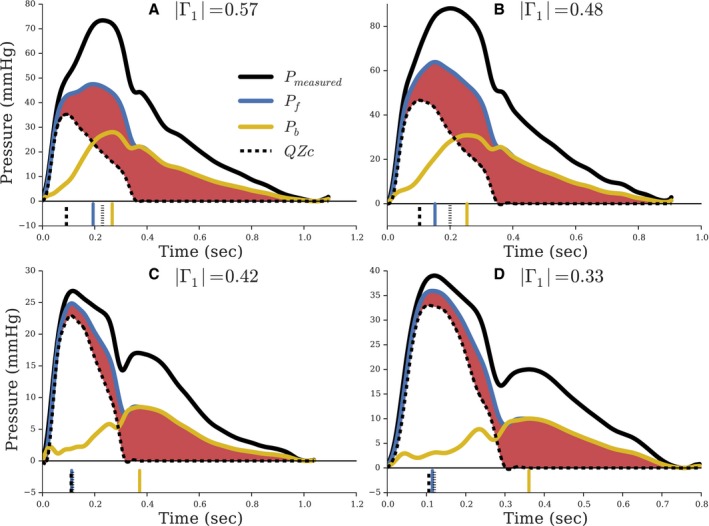
Pressure and flow waveforms from a human sample for high reflection ([A] |Γ1|=0.57; [B] |Γ1|=0.48) and low reflection ([C] |Γ1|=0.42; [D] |Γ1|=0.33). The red shaded region highlights portion of Pf unexplained by aortic flow interacting with Zc. The vertical lines at the bottom of each panel indicate timing to peak amplitudes of the corresponding line style. All waveforms are shifted to a common origin to directly compare peak amplitudes.