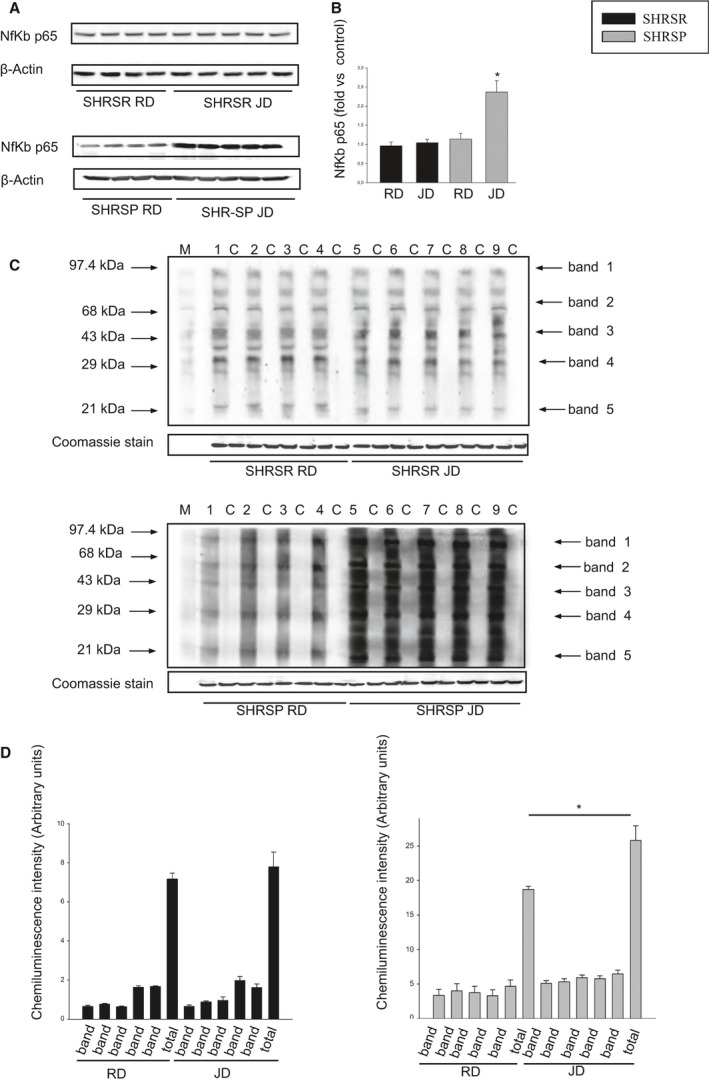
Figure 2.

Molecular analyses in brains of SHRSP as compared to SHRSR under stroke‐permissive diet. A, Representative western blot (n=3) of Nf‐κBp65 in SHRSR and SHRSP upon either RD or JD with corresponding densitometric analysis (B). *P<0.0001 for SHRSP JD versus all other samples. D, Western blot of intracellular protein extracts immunostained for carbonylated proteins using the Oxyblot Protein Oxidation Detection kit (Millipore, Milan, Italy) in brains of SHRSR and SHRSP under either RD or JD. Each lane was loaded with 50 μg of total proteins. Lane M, DNP marker. Each sample is run with its own untreated control (C). Normalization for lane protein loading was performed using Coomassie staining. D, Densitometric analysis of Oxiblot gels. Bar graphs represent chemiluminescence intensity relative to the gel loading band. Bands 1 to 5 refer to the most prominent bands on the blots (identified by arrows), whereas total refers to the total chemiluminescence intensity from all bands. *P<0.0001 for SHRSP JD versus SHRSP RD (total band). Densitometric values are expressed as means±SD. JD indicates Japanese‐style stroke‐permissive diet; Nf‐κB, nuclear factor kappa B; RD, regular diet; SHRSP, stroke‐prone spontaneously hypertensive rat; SHRSR, stroke‐resistant SHR.
