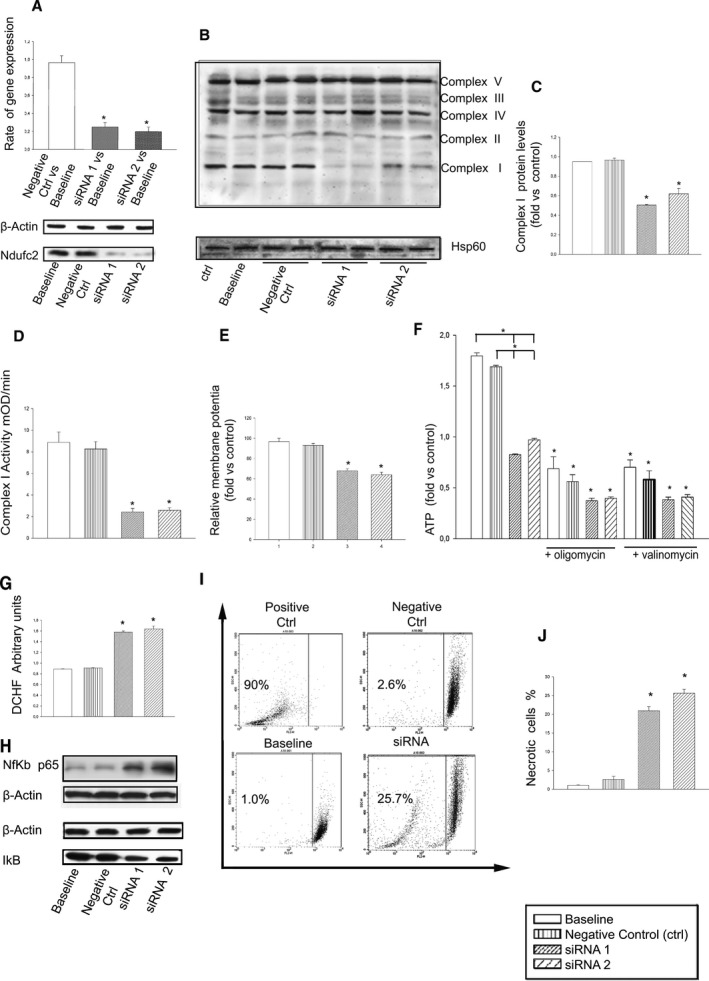
Figure 3.

In vitro Ndufc2 silencing in A10 cells. A, Confirmation of Ndufc2 silencing by RT‐PCR and western blot; *P<0.0001 for each siRNA versus baseline (n=6). B, Representative western blot of BNG (n=3) in silenced versus nonsilenced A10 cells. All complexes belonging to OXPHOS are identified on the right side; Hsp60 was used to normalize protein expression level. C, Densitometric analysis of BNG. *P<0.0001 for each siRNA versus both baseline and negative CTRL. D, Assessment of complex I activity. E, Mitochondrial membrane potential assessment. *P<0.0001 for each siRNA versus both baseline and negative CTRL (n=6). F, Measurement of ATP levels in silenced versus nonsilenced cells and both in the absence and in the presence of oligomycin and valinomycin (to confirm functionality of the ATP assay as specified above). *P<0.0001 for each siRNA versus baseline and versus negative CTRL, and for each inhibited point versus the noninhibited corresponding sample (n=6 for each group). G, Assessment of resctive oxygen species levels; *P<0.0001 for each siRNA versus both baseline and negative CTRL (n=6 for each group). H, Representative western blot (n=3) of Nf‐κBp65 and of its inhibitor, IκB, in silenced versus nonsilenced cells, showing that increases of Nf‐κBp65 expression are accompanied by decreases of IκB expression levels. I, FACS analysis and corresponding percent values of necrotic cells (J). *P<0.0001 for each siRNA versus both baseline and negative CTRL (n=5). Values are expressed as means±SD. Ctrl indicates control; DCHF, 2′,7′‐dichlorodihydrofluorescein; FACS, fluorescence‐activated cell sorting; Hsp60, heat shock protein 60; IκB, nuclear factor of kappa light polypeptide gene enhancer in B‐cells inhibitor; Nf‐κB, nuclear factor kappa B; RT‐PCR, reverse‐transcriptase polymerase chain reaction.
