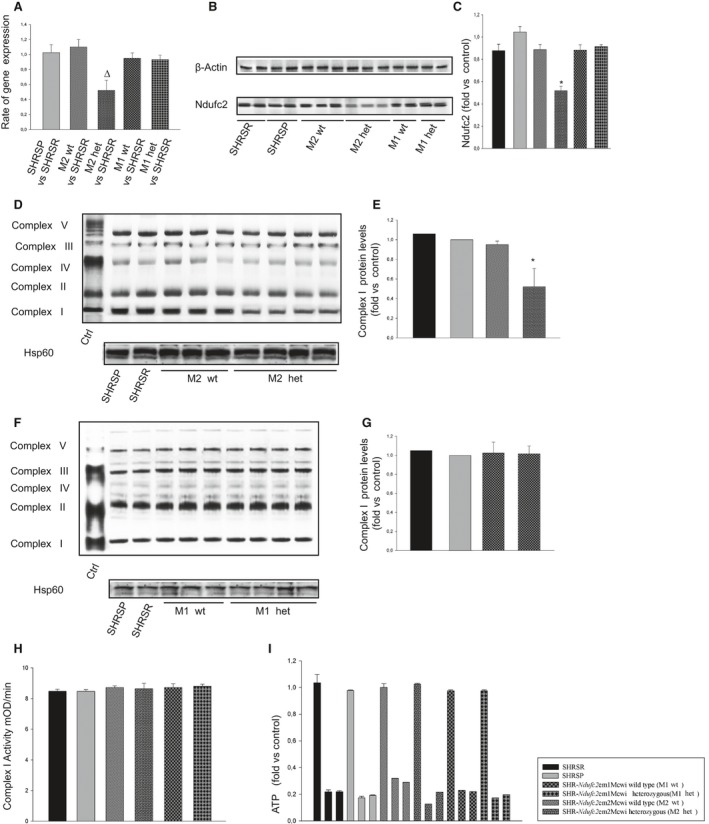
Figure 5.

Molecular analyses of brains of all strains at 6 weeks of age. A through C, Brains of heterozygous SHR‐Ndufc2 em2Mcwi showed significantly lower amount of Ndufc2 mRNA and protein expression, as compared to both parental SHRSR and SHR‐Ndufc2 em1Mcwi. Δ P<0.01 versus SHRSR; *P<0.0001 versus all other samples (n=6 for each group). D through G, Representative western blot of BNG (n=3) showing defective complex I assembly only in heterozygous SHR‐Ndufc2 em2Mcwi rats. Corresponding densitometric analyses are shown on the right side of each blot. *P<0.0001 versus all other samples. H, Complex I activity and (I) ATP levels were comparable among all strains at this age (n=3). Values are expressed as means±SD. Ctrl indicates control; het, heterozygous; Hsp60, heat shock protein 60; SHRSP, stroke‐prone spontaneously hypertensive rat; SHRSR, stroke‐resistant SHR; wt, wild type.
