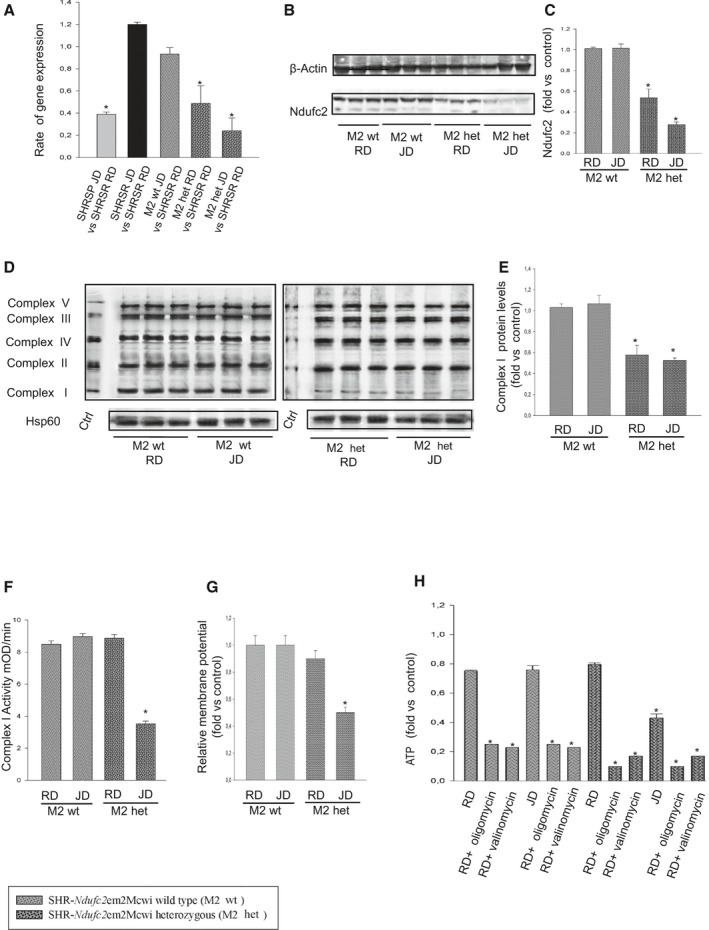
Figure 6.

Molecular analyses in brains of both wild‐type and heterozygous SHR ‐Ndufc2 em2Mcwi lines at the end of 4 weeks exposure to either RD or JD. A, Brain Ndufc2 expression in both wild‐type and heterozygous SHR‐Ndufc2em2Mcwi is compared to that of RD‐fed parental SHRSR; *P<0.0001 for each indicated ratio (n=5). B, Ndufc2 protein expression levels in brains of wild‐type and heterozygous SHR‐Ndufc2 em2Mcwi (number of western blots=3) with corresponding densitometric analysis (C); *P<0.0001 for heterozygous SHR‐Ndufc2 em2Mcwi upon RD and JD versus wild type. D and E, Representative western blots of BNG in wild‐type and heterozygous SHR‐Ndufc2 em2Mcwi (n=3 each) with corresponding densitometric analysis. *P<0.0001 for heterozygous SHR‐Ndufc2 em2Mcwi upon RD and JD versus wild type. F, Complex I activity measurement; (G) mitochondrial membrane potential assessment; *P<0.0001 for heterozygous SHR‐Ndufc2 em2Mcwi upon JD versus RD and versus wild‐type line at both RD and JD (n=5 each). H, ATP levels measurement in both wild‐type and heterozygous rat lines upon RD or JD (n=5 each). *P<0.0001 for heterozygous SHR‐Ndufc2 em2Mcwi versus wild‐type line and for each inhibited point versus the not inhibited corresponding sample. Values are expressed as means±SD. BNG indicates Blue Native–PAGE; Ctrl, control; het, heterozygous; Hsp60, heat shock protein 60; JD, Japanese‐style stroke‐permissive diet; RD, geular diet; SHRSP, stroke‐prone spontaneously hypertensive rat; SHRSR, stroke‐resistant SHR; wt, wild type.
