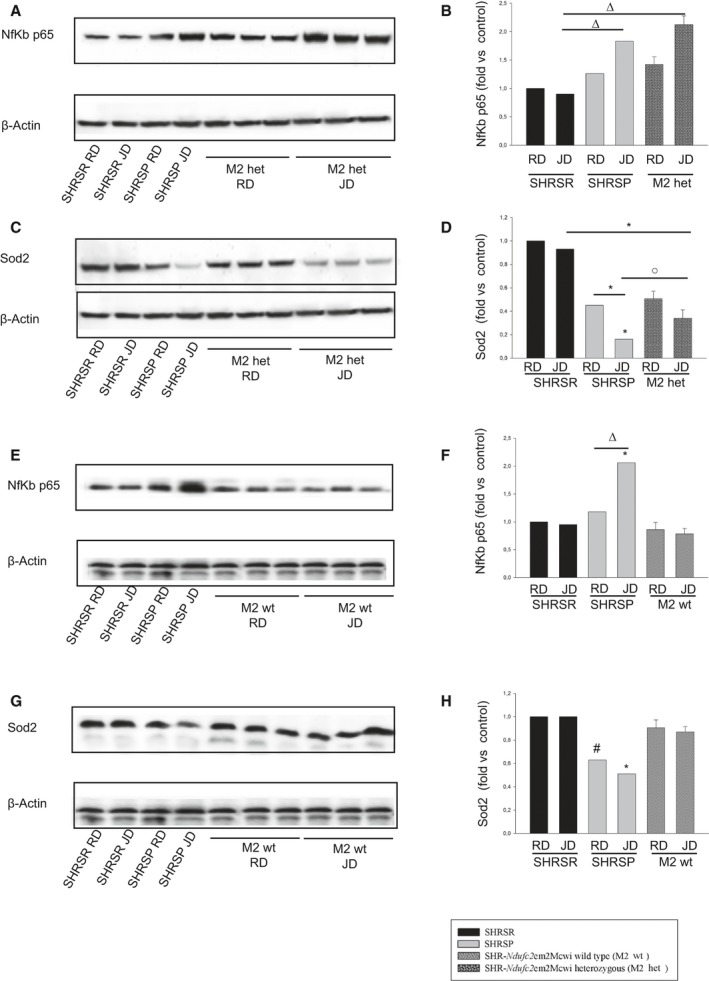
Figure 8.

Molecular analyses in brains of wild‐type and heterozygous SHR ‐Ndufc2 em2Mcwi at the end of either RD or JD exposure. A through D, Representative western blots of Nf‐kBp65 and of SOD2 (n=3) with corresponding densitometric analysis in brains of heterozygous SHR‐Ndufc2 em2Mcwi, as compared to parental, lines at the end of 4 weeks of either RD or JD feeding. E through H, Same analyses (n=3) were performed in brains of wild‐type SHR‐Ndufc2 em2Mcwi. Densitometric values are expressed as means±SD. Significance values: (B) Δ P<0.01 for SHRSP JD and heterozygous SHR‐Ndufc2 em2Mcwi JD versus SHRSR JD. C, *P<0.0001 for heterozygous SHR‐Ndufc2 em2Mcwi JD versus SHRSR JD; for SHRSP JD versus SHRSP RD and versus all other samples; ο P<0.05 for SHRSP JD versus heterozygous SHR‐Ndufc2 em2Mcwi JD. F, *P<0.0001 for SHRSP JD versus all other samples; Δ P<0.01 for SHRSP JD versus SHRSP RD. H, # P<0.001 and *P<0.0001 for SHRSP JD versus all other samples. Het indicates heterozygous; JD, Japanese‐style stroke‐permissive diet; Nf‐κB, nuclear factor kappa B; RD, geular diet; SHRSP, stroke‐prone spontaneously hypertensive rat; SHRSR, stroke‐resistant SHR; Sod2, superoxide dismutase 2, mitochondrial; wt, wild type.
