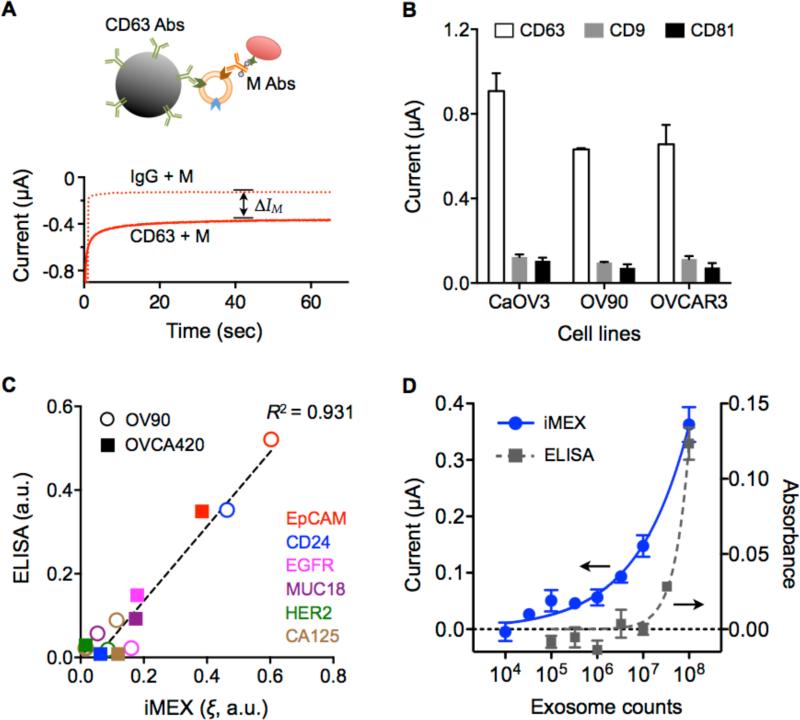
Figure 2. Characteristics of the iMEX diagnostic platform.
(A) Schematic of the electrochemical measurement in the iMEX assay. With –100 mV reduction potential, the current level was reached a plateau within 1 minute. The current difference between the CD63-bead and IgG-bead samples (ΔIM) was used as a representative value of a target protein marker. Abs, antibodies. M, marker. (B) Signal comparison of three tetraspanin markers (CD63, CD9, and CD81) in cancer exosomes. Signals from CD63 were much higher than those from other markers in exosomes collected from ovarian cancer cell lines (CaOV3, OV90, and OVCAR3). (C) Comparison between iMEX and ELISA. Six surface proteins were profiled in two ovarian cancer cell lines (OV90 and OVCA420). The results showed high correlation (R2 = 0.931). a.u., arbitrary unit. (D) Varying number of exosomes were spiked into human plasma and assayed by iMEX and ELISA. The detection limits were 3×10⁴ (iMEX) and 3×10⁷ (ELISA). All measurements were performed in triplicate, and the data are displayed as mean ± SD.

