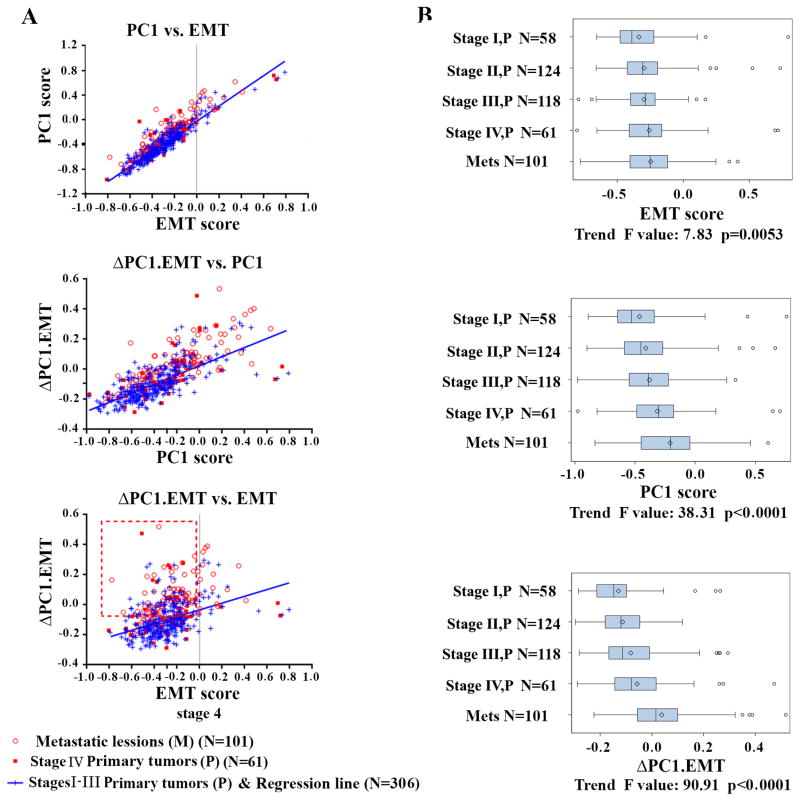
Figure 1. Correlation of PC1, EMT and ΔPC1.EMT scores with each other and with stages, and metastasis on the Moffitt468 CRC dataset.
(A Top panel) PC1 vs. EMT shows strong correlation but metastatic tumor (open red circles) and Stage IV primary tumors with evidence of synchronous metastasis (filled red squares) displayed a slight propensity for higher PC1 scores than EMT scores compared to Stages I-III primary tumors (blue repression line). The gray line (EMT=0) is the dividing line as defxined (8) (EMT<0, non-EMT epithelial-like; EMT>0, EMT mesenchymal-like). (A, middle and bottom panels) ΔPC1.EMT outperformed EMT and PC1 in predicting metastasis. Red box highlights higher ΔPC1.EMT (above the median value)-captured non-EMT subpopulations (EMT<0). (B) Comparison between ΔPC1.EMT, PC1 and EMT scores in progressively deciphering metastatic potential of primary CRCs (stages I vs. II vs. III vs. IV) vs. metastatic lesions. Trend F and P values are given for the three scores. Six samples that lack stage information were removed.

