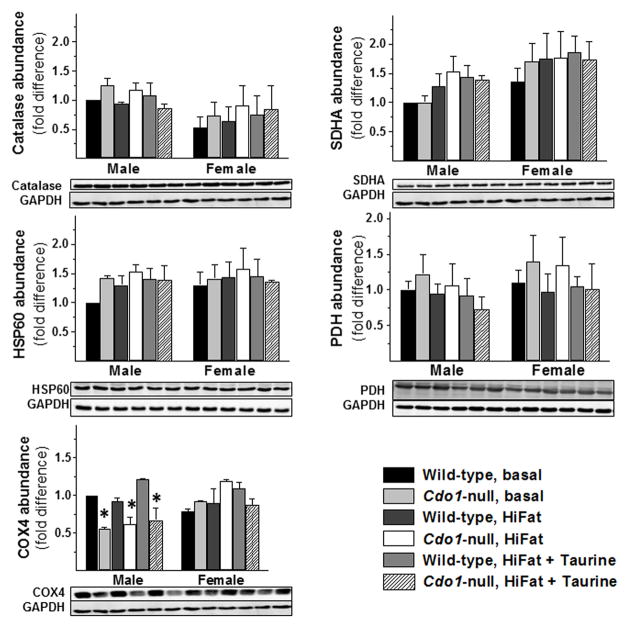
Figure 5.
Relative abundance of catalase, SDHA, HSP60, PDH, and COX4 in livers of wild-type and Cdo1−/− mice fed the basal, HiFat, or HiFat+Tau diet for 3.3 weeks. Each bar represents the mean ± SEM for the indicated group of mice; n = 6–10 mice per group. Bars denoted by * indicate that the value for Cdo1−/− mice is different from the value for wild-type mice of the same sex and dietary treatment. Representative western blots are shown below the bar graphs for protein abundances.

