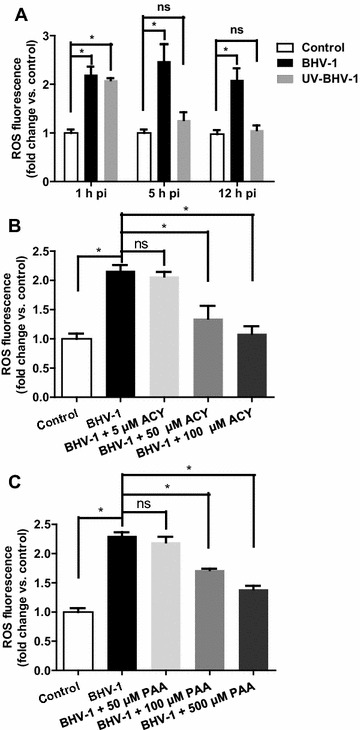
Figure 1.

Intracellular ROS was increased following BHV-1 infection. A MDBK cells were infected with UV-inactivated or untreated BHV-1 at MOI of 10. At indicated time point, H2DCFDA (5 μM, 30 min) was loaded for visualization of ROS with fluorescence microscopy. B and C MDBK cells pretreated with inhibitor ACY (B) or PAA (C) at indicated concentrations were infected with BHV-1 (MOI = 10) in the presence of corresponding inhibitor. At 4 h pi intracellular ROS were detected with H2DCFDA. Quantification of fluorescence intensity was performed using Image-pro Plus 6. The measured fluorescence intensity were expressed as a relative fold change vs. that in the control cells. Data represent three independent experiments with triplicates performed at each time. Statistical analyses were performed using Student’s t test (Asterisk indicates P < 0.05 vs. control).
