
Fig. 3.
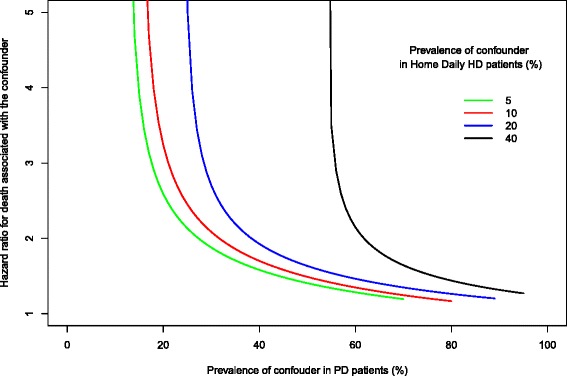
Effect of unmeasured confounding. This sensitivity analysis illustrates how powerful a single unmeasured confounder (e.g., “frailty”) would have to be to account for the survival advantage of daily home HD over PD. The y-axis denotes the hazard ratio that would have to be associated with the unmeasured confounder to raise the upper limit of the 95 % CI of the primary analysis effect estimate to include unity (1.0, no association). For example, if the prevalence of the unmeasured confounder was 5 % in the daily HD group and 20 % in the PD group, a hazard ratio of 2.63 associated with the confounder would be required to account for the observed advantage of daily HD over PD in the main analysis (see text)