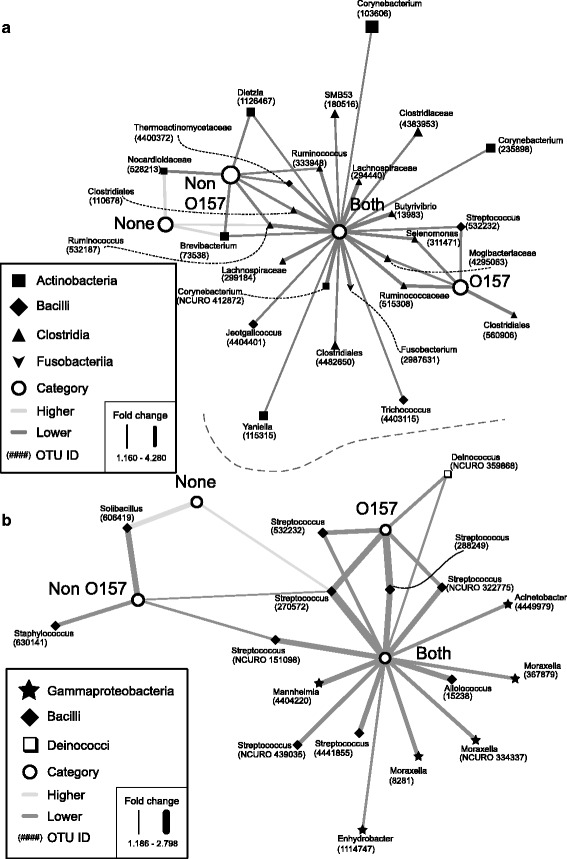
Fig. 4.

OTUs with significantly different relative abundance according to tesing status. a All hide OTUs (AHO). b Hide-specific OTU (HSO). White circles indicate the testing status of groups of samples: EHEC negative; O157 only; non-O157 only; and both non-O157 and O157. Black nodes are OTUs with significantly higher (P < 0.05) or lower relative abundance. The shape of OTU nodes is based on class: black diamond Bacilli, black up-pointing triangle Clostridia, black square Actinobacteria, black star Gammaproteobacteria, white square Deinococci, black down-pointing triangle Fusobacteria. Labels indicate the genus of the OTU. OTU numbers from the cluster analysis are indicated in parentheses. A dark gray line represents lower average relative abundance. Light gray lines indicate higher relative abundance. Edge width is proportional to fold-change, with a thicker line representing a higher shift in abundance. When genus information was not available, family or order is indicated
