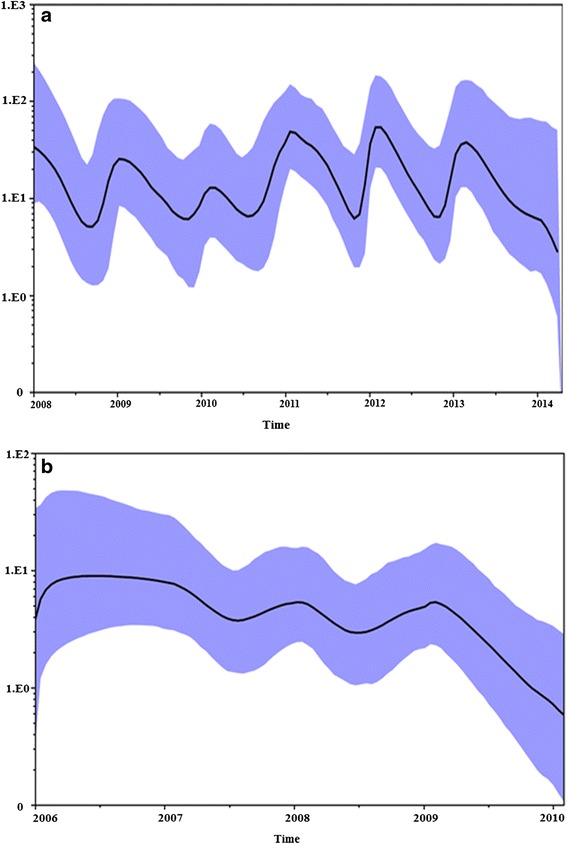
Fig. 5.

a The Bayseian skyride analysis of the 2.2.1.2 cluster from 2009 to 2014 showing changes in genetic diversity with 95 % HPD values. The rate of genetic diversity is proportional to increased annual prevalence peaks. b The Bayseian skyride analysis of the variant clusters from 2007 to 2011 showing changes in genetic diversity with 95 % HPD values. The genetic diversity showed a sharp decline in 2011
