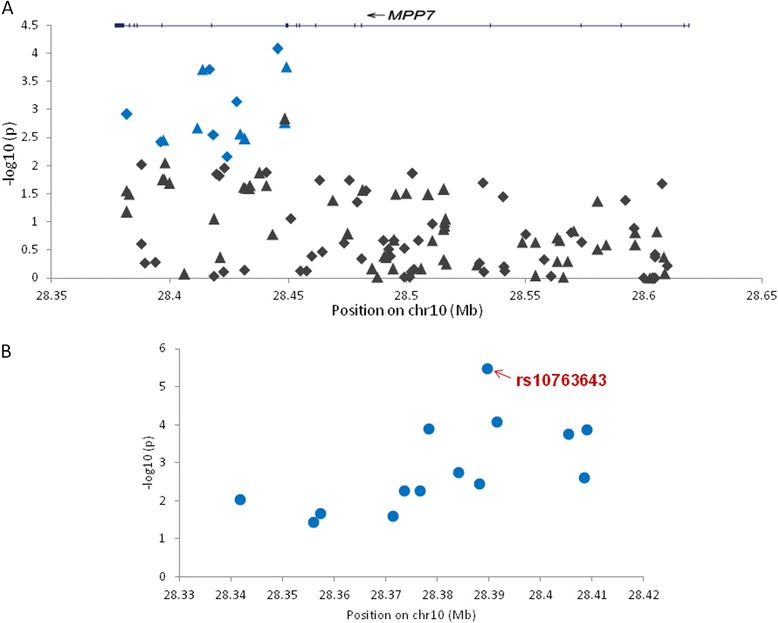
Fig. 2.

Association of MPP7 SNPs in Discovery and validation phase. a The plot shows a total of 130 SNPs from MPP7 locus in discovery phase. The genotyped SNPs are represented as diamonds and imputed SNPs are represented as triangles. The blue colour denotes 14 SNPs of MPP7 clump which were selected for validation phase. b This plot represents data of 14 MPP7 clump SNPs in the validation phase. All 14 SNPs have a p < 0.05. X-axis denotes the genomic position of SNPs in Mb (human genome build 36) and Y-axis represents –log10 p-values. The most significant SNP in the validation phase is marked with an arrow
