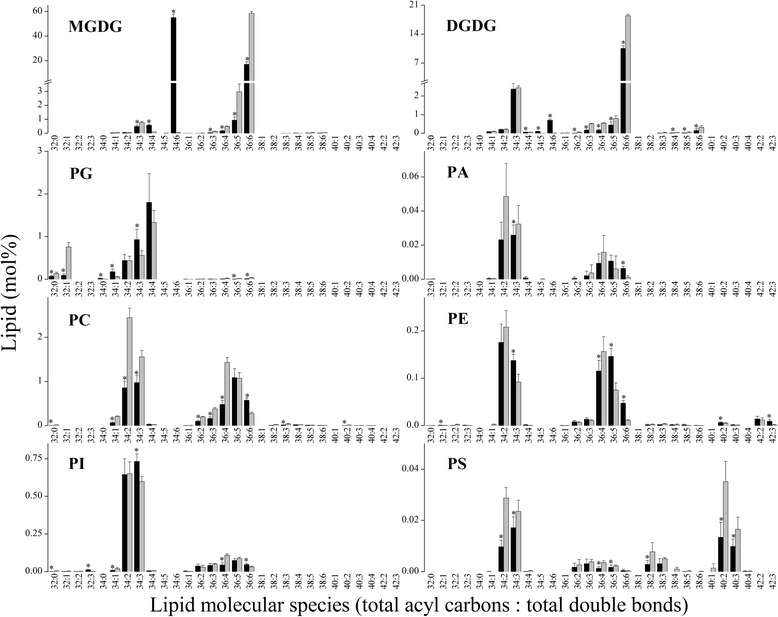
Fig. 1.

Compositions of lipid molecular species in cold acclimated Arabidopsis (black bars) and normal growth rice (light grey bars). The bars show relative content (mol%) values for all measured samples. An asterisk shows that the value in Arabidopsis is significantly different from that in rice (p < 0.05). Values are means ± S.D. (n = 5)
