
Fig. 3.
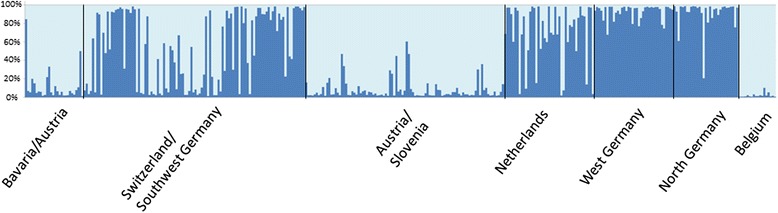
Bar plot of a Bayesian cluster analysis done with STRUCTURE [30] (light blue = genotype 1, dark blue = genotype 2)
Official websites use .gov
A
.gov website belongs to an official
government organization in the United States.
Secure .gov websites use HTTPS
A lock (
) or https:// means you've safely
connected to the .gov website. Share sensitive
information only on official, secure websites.
Bar plot of a Bayesian cluster analysis done with STRUCTURE [30] (light blue = genotype 1, dark blue = genotype 2)