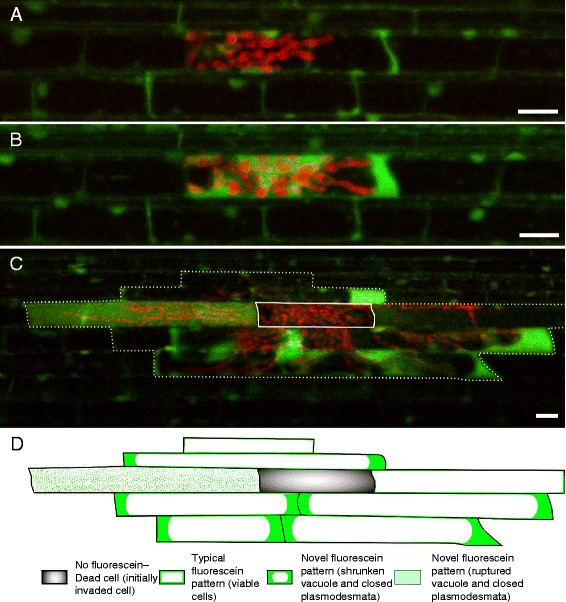
Fig. 4.

Time-course of the dynamics of host cell death during rice blast invasion. a Confocal image showing M. oryzae CKF1997 (red) infection in a rice sheath epidermal cell at 30 hpi. Rice cells contained typical cytoplasmic fluorescein. b The same infection in (a) imaged 2 h later showing a novel fluorescein pattern (brighter fluorescence in the enlarged cytoplasm). c The same infection in (b) imaged 15 h later. The sample was stained again with FDA to renew fluorescein. The first invaded cell (solid white outline) lacked fluorescein, indicating it was dead by this time. Partially invaded cells showed either typical cytoplasmic fluorescein or novel fluorescein patterns. Dotted white line outlines the cells (total nine cells) infected by hyphae. Bars = 20 μm. d Schematic representation of infected cells in (c) with fluorescein pattern classification
