Fig. 1.

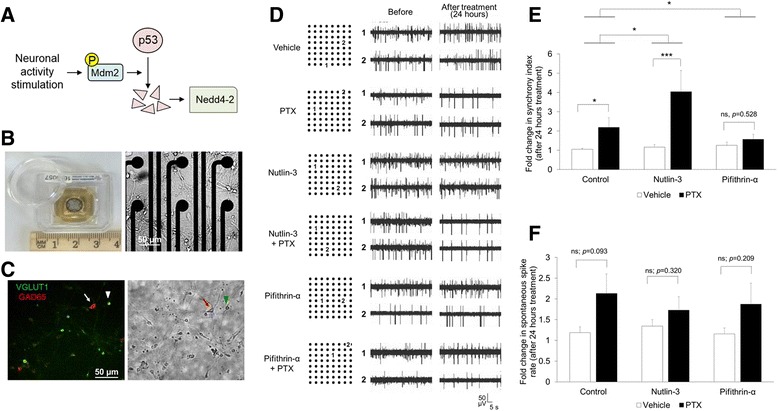
Mdm2-p53 signaling provides feedback modulation for neural network synchrony after stimulation of neuronal activity. a A schematic of Mdm2-p53-Nedd4-2 signaling. b A picture of a multi-electrode array (MEA) dish (left) and a representative image of cultured cortical neurons growing in a MEA dish at DIV 13 (right). c A representative immunohistochemical image (left) and the corresponding bright field picture (right) showing a mixture of excitatory neurons (VGLUT1-positive, indicated by a green arrowhead) and GABAergic interneurons (GAD65-positive, indicated by a red arrow) in our cultures. d Representative traces of recordings from 2 electrodes that are over 400 μm away from each other. Selected electrodes are marked with “1” and “2” on the electrode map (left). Traces from the same electrodes before or after 24-h treatment are shown on the right. e Quantification of synchrony index from entire MEA after 0- or 24-h treatments as indicated. f Quantification of spontaneous spike rates (spikes/sec) from entire MEA after 0- or 24-h treatments as indicated. Plotted is the average of “after treatment” normalized to the mean of its own “before treatment” for each MEA. ANOVA with post-hoc Tukey test was used. (n = 5–8 cultures, *p < 0.05, ***p < 0.001, ns: non-significant)
