Fig. 1.

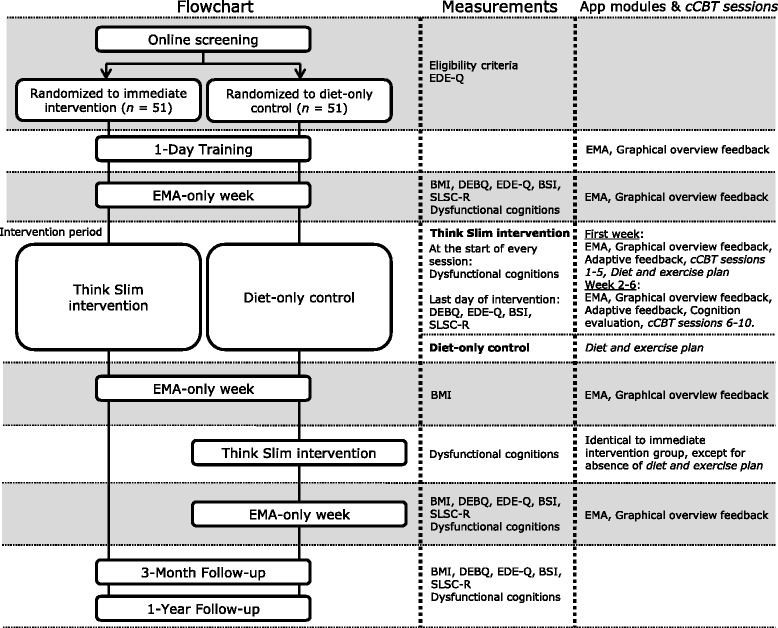
Flowchart for the immediate intervention and diet-only control groups. Note: timing for the 3-month and 1-year follow-up measurements will be calculated from the end of the last Ecological Momentary Assessment (EMA)-only week for both groups

Flowchart for the immediate intervention and diet-only control groups. Note: timing for the 3-month and 1-year follow-up measurements will be calculated from the end of the last Ecological Momentary Assessment (EMA)-only week for both groups