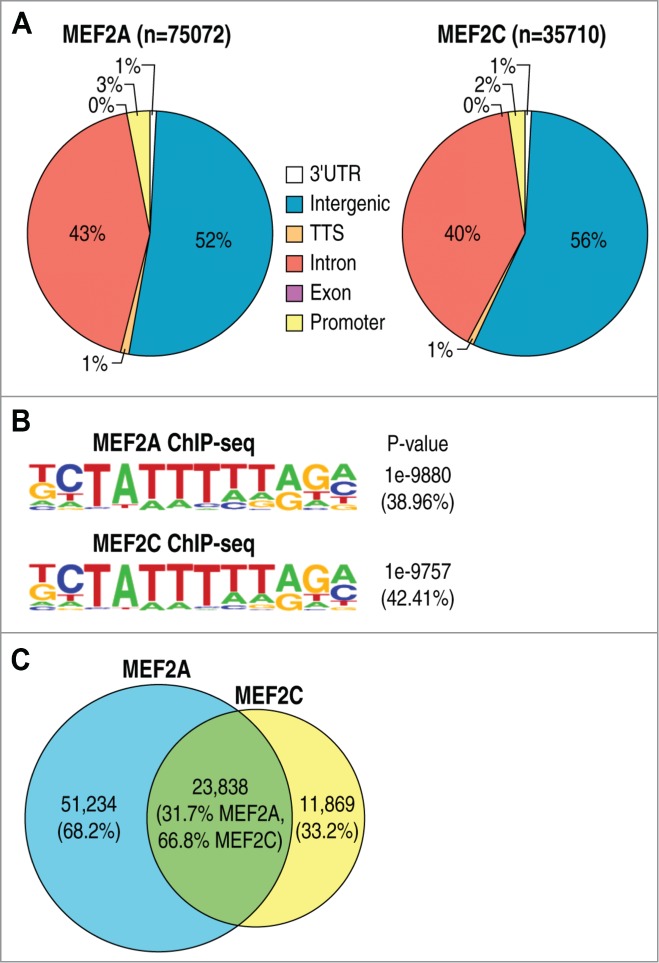
Figure 1.

Analysis of MEF2A and MEF2C ChIP-Seq experiments in mouse cortical neurons. (A) Pie charts showing the genomic distribution of MEF2A binding sites in the genome. (B) Pie charts showing the genomic distribution of MEF2C binding sites in the genome. (C) De novo motif analysis of MEF2A or MEF2C-bound genomic regions showing the top enriched sequence motifs. P-values and frequencies of motifs are indicated.
