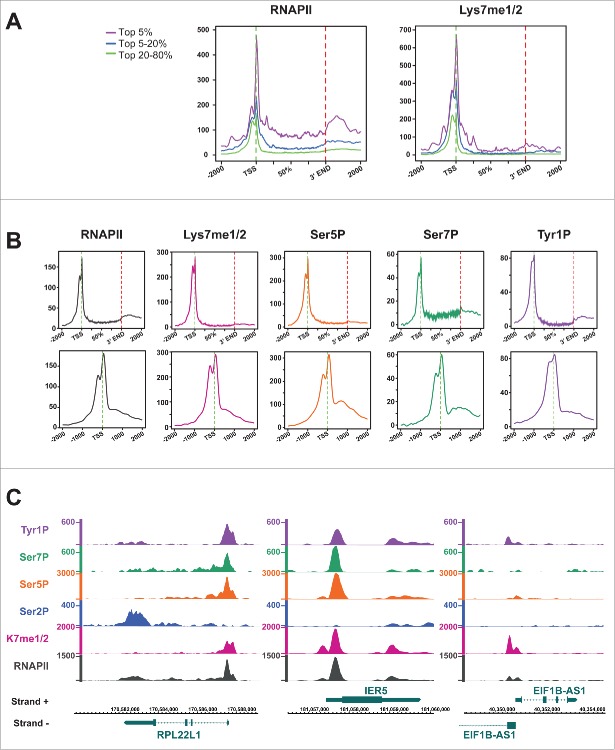
Figure 5.
Genome-wide RNAPII and CTD K7me1/2 methylation profiles. (A) Diagram summarizing the average transcription unit with representative clusters for RNAPII and CTD K7me1/2 occupancy profiles of top 5%, 20%, 20–80% of signals across the genome using average transcription unit analysis (see Methods). (B) Distribution of RNAPII upstream and downstream of TSS for the top 20% of genes >4kb. (C) Examples of gene RPL22L1 (Ribosomal Protein L22-like-1), IER5 (immediate early response 5) and EIF1B (eukaryotic translation initiation factor 1B) showing RNAPII distribution and signals for Tyr1P, Ser7P, Ser5P, Ser2P, and CTD Kme1/2. Strand (+) shows genes in 5' – 3′ and strand ( − ) in 3′ − 5' orientation.

