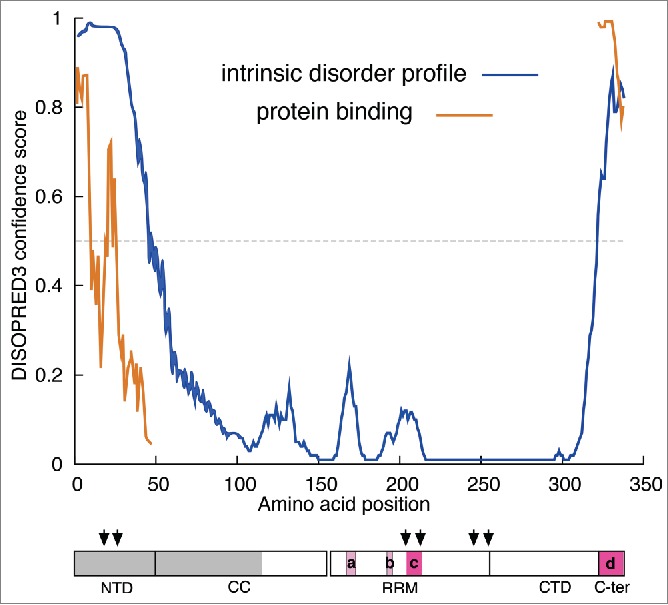
Figure 4.

Intrinsic disorder profile of ORF1p The profiles of intrinsically disordered sequence and potential protein binding surface were generated by DISOPRED3. The cartoon showing the monomer domains is the same as that in Figure 1A, annotated as follows: The gray box indicates the region of the protein that had been deleted prior to expression in E. coli.25 The mauve and red boxes indicate the amino acids missing from the X-ray structure in the 2yko PDB file – (a), positions 167–172, monomer B; (b), 191–193, and 190–194, monomers A and B respectively; (c), 204–210, 204–210, 203–212 monomers A, B, and C respectively; (d), 323–338, monomers A, B, and C.
