Fig. 2.

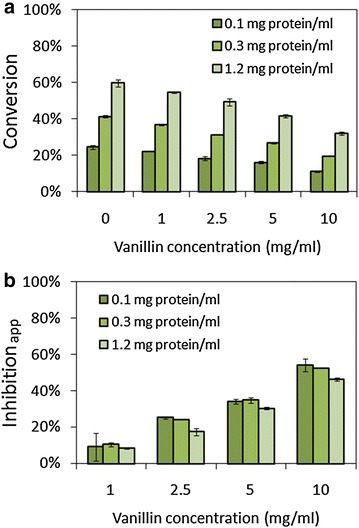
Effect of enzyme concentration on cellulose conversions (a) and apparent inhibition (b) at 24 h of hydrolysis. Cellulose loading was 1 %. Error bars represented standard deviations, n = 3

Effect of enzyme concentration on cellulose conversions (a) and apparent inhibition (b) at 24 h of hydrolysis. Cellulose loading was 1 %. Error bars represented standard deviations, n = 3