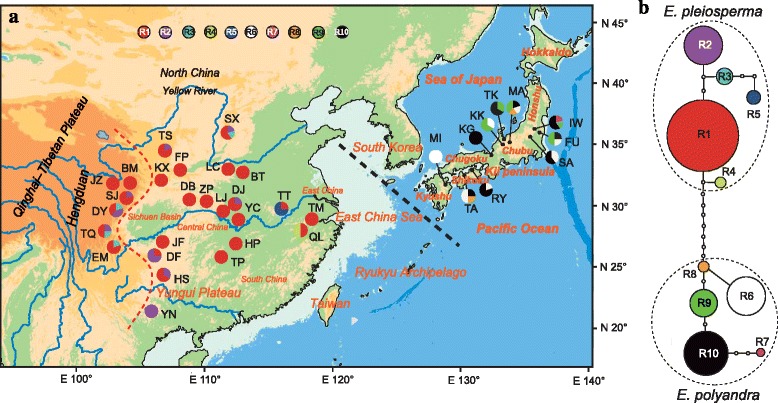
Fig. 2.

a Distribution of ITS ribotypes in the 36 populations of Euptelea (see Additional file 2: Table S1 for population codes). Red and black dashed lines are identified in Fig. 1. b tcs-derived network of genealogical relationships between the 10 ribotypes of the two species. Each circle denotes a single ribotype, with size proportional to frequency. Small open circles represent missing ribotypes
