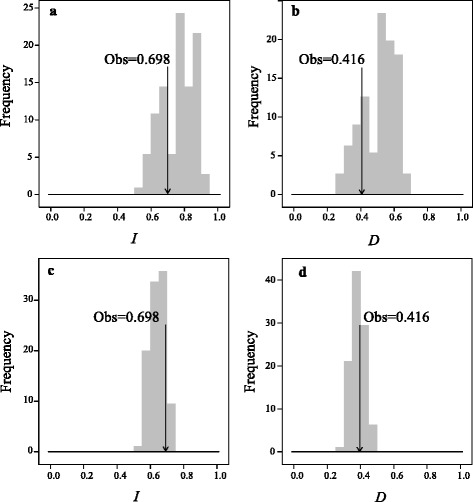
Fig. 7.

Results of the niche identity tests for five non-correlated (a, b) and nineteen (c, d) BIOCLIM variables between western and central-eastern populations of E. pleiosperma. The vertical line in each map represents the observed values of niche similarity (both D and I) while the histograms represent those of null distributions
