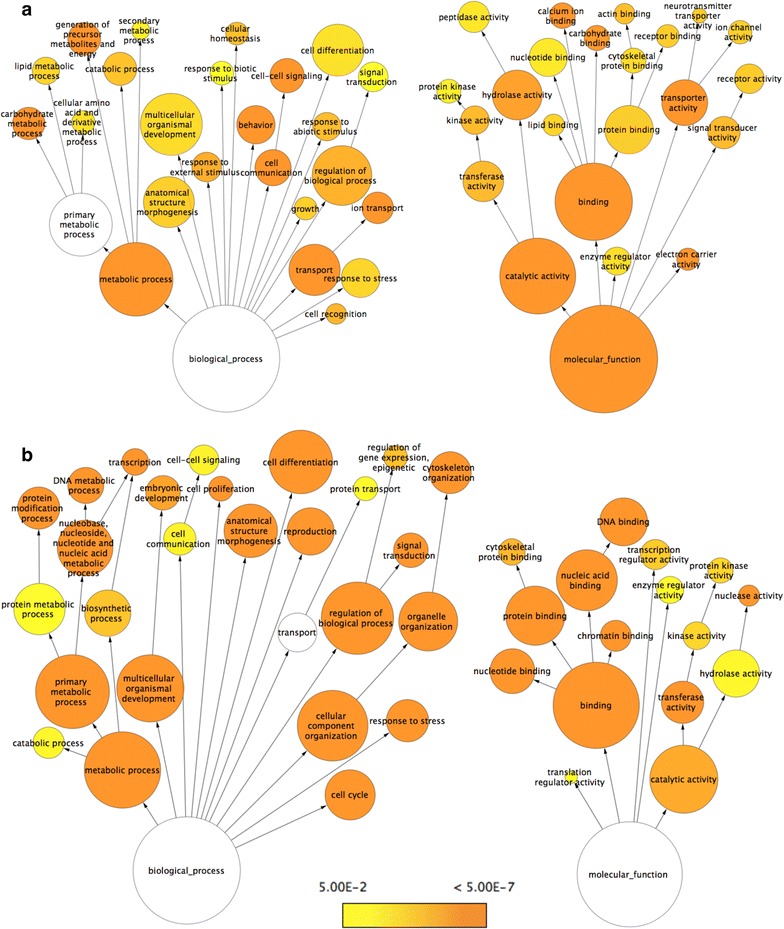
Fig. 7.

Cytoscape BiNGO visualization of overrepresented Gene Ontology (GO) categories in differentially expressed genes between summer and winter bodies of D. suzukii in the context of the GO hierarchy. Enriched GO terms that are (a) up-regulated and (b) down-regulated in winter bodies relative to summer bodies are classified by biological process (left) and molecular function (right). The size of each circle represents the number of genes that are included in each GO term and the color of the circle indicates the enrichment p value for the labeled GO term. As indicated in the enrichment scale, orange represents the highest enrichment and yellow represents the minimum enrichment above the cutoff (FDR corrected = 0.05). White circles represent nodes that are not enriched; they are shown in the figure to illustrate the GO term hierarchy and are only present if their “leaf nodes” are enriched. The hierarchical layout in Cytoscape was used to arrange the networks with manual adjustment of the nodes to allow for visualization of the text labels
