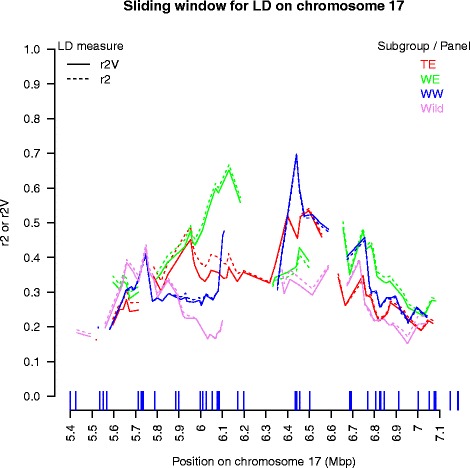
Fig. 6.

Mean local LD (r 2 V) in a 300 Kb-sliding window along the chromosome 17 genomic region. Local LD was computed separately in each subgroup of the association panel and in the wild panel. Only mean LD values based on at least ten marker pairs are plotted. Vertical lines on the x-axis indicate SNP positions
